



















Déjà vu: What’s next for markets after the latest spike in oil prices?
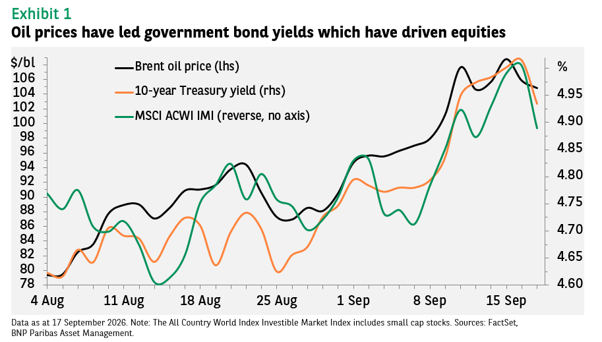
The latest oil price spike has been followed by rising government bond yields globally, which in turn have led to declines in equity markets (see Exhibit 1). While fed funds rate expectations are important, these have already been priced in for the most part.
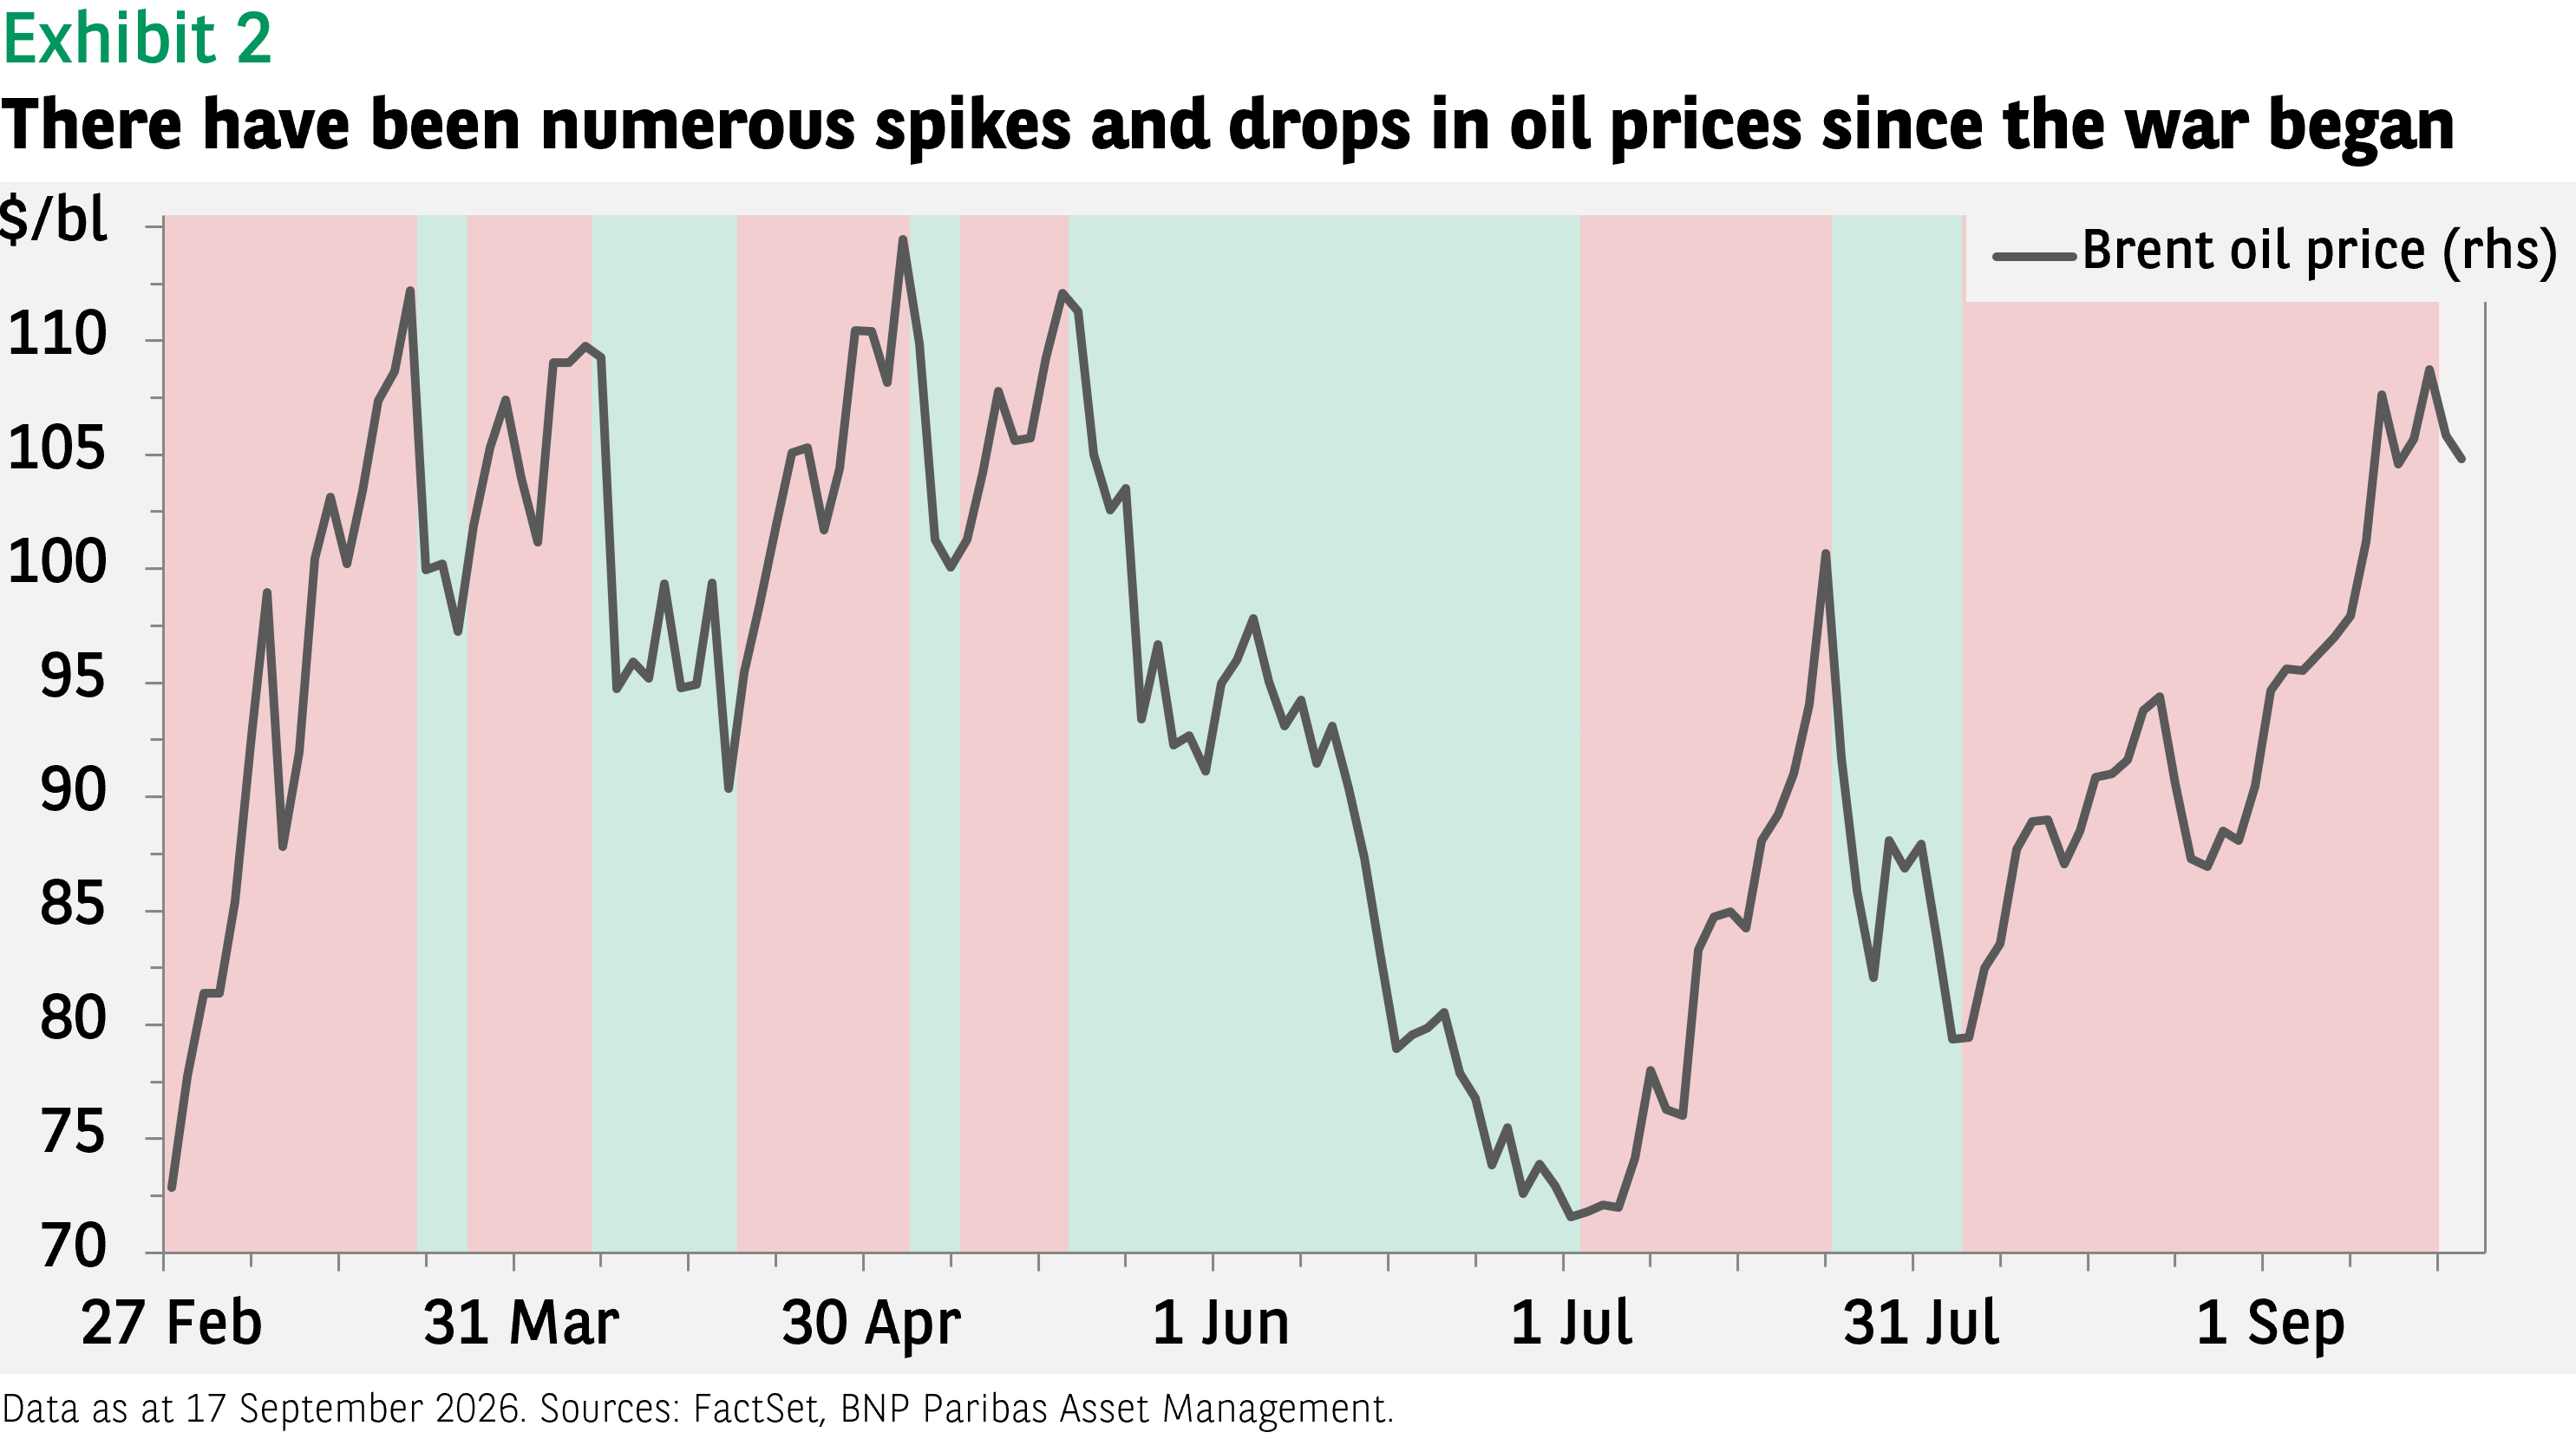
This is the sixth time oil prices have spiked since the Iran war began, each followed by a period of falling prices (see Exhibit 2). We would expect the pattern to continue in the months ahead.
We can examine these episodes to see if the reaction of markets to the current spike is similar to those in the past and to anticipate what may come next.
Unsurprisingly, the energy sector outperformed in almost every episode when oil prices rose sharply and it is the only sector which had positive returns on average over all six episodes (see Exhibit 3). Materials also did well as commodities broadly benefited, though returns for the sector were still negative on average.
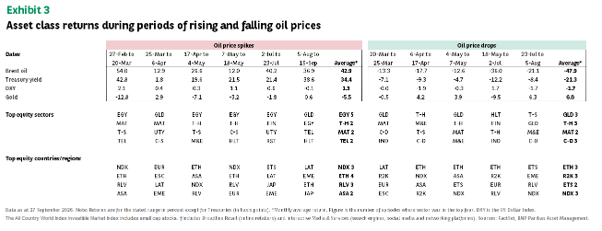
Other defensive sectors that investors might have looked to, such as utilities, did not quite come through: utilities was one of the top four performing sectors in just two episodes. Telecommunication services did somewhat better, ranking fourth.
The second-best performing sector was technology hardware, though it still had negative returns in four of the six episodes. Typically, rising interest rates have a disproportionately negative impact on returns for technology stocks as earnings are expected further out in the future than for other sectors, meaning the increase in the discount rate has a larger effect on the net present value.
Given that so much of the sector’s earnings growth is currently nearer term thanks to the artificial intelligence boom, the impact may have been muted.
A perhaps more important consideration is that the AI theme is now simply so strong that changes in interest rates have only a modest impact on the sector’s returns. Earnings growth is the primary driver.
The risk to the sector is instead anything that threatens the earnings outlook, as recent discussions about the need to “pace the frontier” of AI model development have momentarily done.
The performance of country and regional equity indices largely reflects their sector composition. The Nasdaq, emerging market technology stocks, and the MSCI EM Asia index outperformed most consistently, reflecting the large tech hardware weighting in the index. The other outperformer was the Russell 1000 Value index, which has a large energy sector component.
What goes up will hopefully come down
At some point the current increase in oil prices should reverse. How might investors want to be positioned to take advantage of the anticipated market rebound?
Gold’s negative correlation with interest rates stands out, as the price of gold averaged a near 7% monthly gain when oil prices fell. This was mirrored in the outperformance of gold miners and the materials sector.
Technology hardware ranked again at the top, reinforcing the notion that oil price and interest rate swings are not a key factor in the sector’s performance. This is one reason we remain positive on the long-term build out of AI infrastructure.
The list of the top performing country and regional indices again reflects the underlying sector returns: emerging market technology and Nasdaq re-appear, joined by emerging market software stocks.
The other new edition is the Russell 2000 US small cap index, which remains sensitive to changes in interest rates. Given that the earnings growth outlook for the index is better than for most other major indices, a stable or falling interest rate environment should support returns in the future.
Data sources: Bloomberg, FactSet, BNP Paribas Asset Management as of 17 September 2026 (unless otherwise stated). Past performance should not be seen as a guide to future returns.


Disclaimer
This document is for informational purposes only and does not constitute investment research or financial analysis relating to transactions in financial instruments as per MIF Directive (2014/65/EU), nor does it constitute on the part of BNP PARIBAS ASSET MANAGEMENT Europe or its affiliated companies an offer to buy or sell any investments, products or services, and should not be considered as solicitation or investment, legal or tax advice, a recommendation for an investment strategy or a personalized recommendation to buy or sell securities.
Due to its simplification, this document is partial and opinions, estimates and forecasts herein are subjective and subject to change without notice. There is no guarantee forecasts made will come to pass. Data, figures, declarations, analysis, predictions and other information in this document is provided based on our state of knowledge at the time of creation of this document. Whilst every care is taken, no representation or warranty (including liability towards third parties), express or implied, is made as to the accuracy, reliability or completeness of the information contained herein. Reliance upon information in this material is at the sole discretion of the recipient. This material does not contain sufficient information to support an investment decision.
Issued in the UK by AXA Investment Managers UK Limited, which is authorised and regulated by the Financial Conduct Authority in the UK. Registered in England and Wales, No: 01431068. Registered Office: 22 Bishopsgate, London, EC2N 4BQ.
AXA IM and BNPP AM are progressively merging and streamlining our legal entities to create a unified structure
AXA Investment Managers joined BNP Paribas Group in July 2025. Following the merger of AXA Investment Managers Paris and BNP PARIBAS ASSET MANAGEMENT Europe and their respective holding companies on December 31, 2025, the combined company now operates under the BNP PARIBAS ASSET MANAGEMENT Europe name.