

Did 2020 deliver a premium for the top ESG equities?
There is no shortage of studies highlighting that investors increasingly want their portfolios to be not only financially rewarding but also responsible. It appears that not even the dramatic events of 2020 could put the brakes on this. The 12 months proved to be a boon for responsible investing where in the US, sustainability-focused funds attracted more than $51bn in net new money – a new record and more than twice the 2019 total. A similar picture emerged in Europe, where strategies available to European investors attracted net inflows of €233bn, double that of the previous year.
But beyond asset gathering, our own research suggests that environmental, social and governance (ESG) screening may have delivered a premium during the period when positive news was in short supply. In fact, our analysis of the MSCI All Country World Index (ACWI) in 2020 found that excluding stocks with poor ESG factors delivered a markedly better performance than the benchmark index.
Below we outline how we found that ESG-focused investors, on average, potentially fared better during the tumultuous year.
Mitigating risk
A key part of responsible investing in equities is avoiding stocks with high ESG-related risks. At AXA IM, we employ a screening policy to the vast majority of our assets under management, and we exclude companies that fall into certain categories.
These include controversial weapons, climate risk, ecosystem protection and deforestation, as well as soft commodities, where we aim to avoid short-term financial instruments which may contribute to price inflation in staples such as wheat, rice, or soy. We call these our Sectorial policies.
In addition, many of our strategies apply our ESG Standards policy, with additional exclusions based on severe controversies, white phosphorous, tobacco and low ESG quality.
With the dual aim of delivering sustainable long-term value as well as making a positive impact on society, we wanted to examine whether excluding stocks based on ESG factors makes a positive, negative, or broadly neutral contribution to returns.
Return analysis
We took the MSCI ACWI index and excluded stocks that would be removed according to our Sectorial and ESG Standards policies, on a market capitalisation-weighted basis. This meant jettisoning 5% of the MSCI ACWI from our universe.
We found that both these exclusion policies had a positive impact on benchmark return over the year, particularly our ESG Standards Policies which saw an excess return of 3.22 percentage points (ppt) versus the MSCI ACWI in US dollar terms across 2020.
In combination, the exclusion policies added 3.71 ppt to benchmark performance, with an ex-post tracking error (a measure of risk that tracks the variability between portfolio and benchmark returns) of 1.37%. (Exhibit 1)


While this data shows performance in 2020, no two years are of course the same, and past performance should never be used as an indicator of future returns. However, the excess performance of the universe after exclusions, compared to the benchmark, reinforces our view that companies with better ESG metrics represent potentially better investment opportunities than firms with poor scores.
We use our own ESG scoring methodology to evaluate the ESG performance of companies globally, giving them a score between 0 and 10, and aim to minimise our exposure to companies with an ESG score of below two. Our resulting low ESG Score category, which forms part of the AXA IM ESG Standards policy, excludes stocks with an ESG score of two or lower – which we acknowledge could add an element of size and sector bias to the data. Our Sectorial policies will also add sector biases as we screen out names with climate risk implications for example.
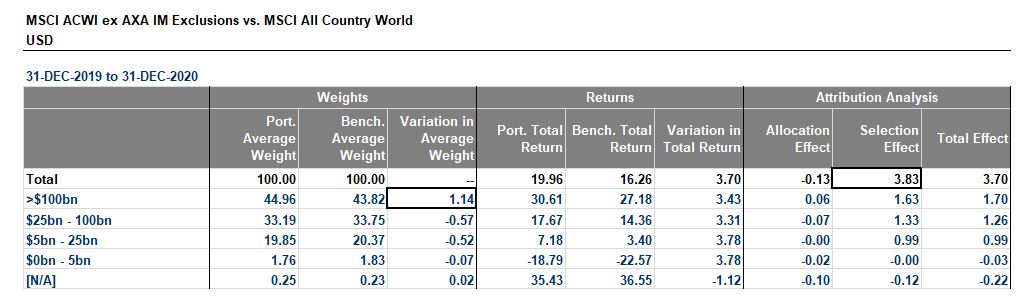
However, Exhibit 2 shows the breakdown of our exclusion universe against the benchmark by market capitalisation. The eligible investment universe is slightly overweight in stocks with a market capitalisation of more than $100bn. But most of the outperformance of this universe versus the benchmark can be attributed to the selection effect across almost all market capitalisation categories. Similarly, an attribution by sector shows 3.83 ppt of the outperformance came from selection effect across all sectors.
Exhibit 2: Comparison of weights, returns and attribution analysis
Was there an ESG premium in 2020?
Using the same MSCI ACWI benchmark index, with an equal weighted weighting scheme, we split the universe into the industry sectors created by MSCI and Standard & Poor’s, known as the Global Industry Classification Standard (GICS). Within those sectors, we split companies into quartiles by market capitalisation. To avoid double counting the impact of dual listings on the returns, secondary listings were excluded from the analysis.
The ESG scores, which are regionally adjusted by design, were then ranked within these intersections to neutralise sector and size biases. The ESG ranks were then split into quartiles, with the first quartile being the highest-ranking names.
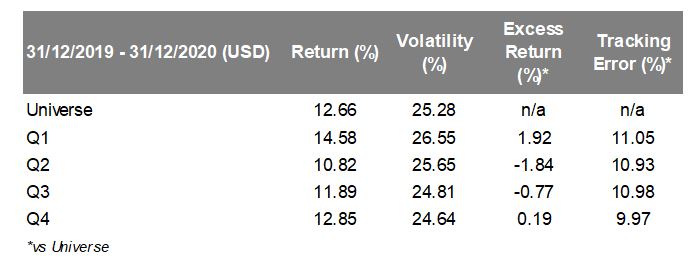
Exhibit 3 shows that the first quartile outperforms the investment universe, delivering an excess return of 1.92 ppt, while the fourth by just 0.19 ppt. However, the first quartile is also more volatile than the rest of the universe – and volatility falls as we look further down the quartiles.
Exhibit 3: Percentage return of MSCI ACWI universe and by quartile
Tackling global challenges while creating value
In a volatile year impacted by the global coronavirus pandemic, the AXA IM Exclusion policies added 3.71 ppt to the benchmark return and did not negatively impact the returns of the opportunity set which has been proxied by the MSCI ACWI. Higher-ranked names in terms of ESG outperformed both the universe and the lower ranked names.
While this analysis cannot be taken as indicative of future performance, it does reinforce our belief that good ESG scores can be a sign of quality and resilience, and not just during periods of volatility, as witnessed in 2020, but more broadly overall.
Fundamentally, we believe ESG analysis – and using this analysis in our investment process and decisions – can potentially lead to more effective investment solutions which not only address global challenges but also create sustainable value for investors. Ultimately, given where society and the planet are now, we anticipate that the popularity of ESG investing is only set to soar.
Disclaimer
This document is for informational purposes only and does not constitute investment research or financial analysis relating to transactions in financial instruments as per MIF Directive (2014/65/EU), nor does it constitute on the part of AXA Investment Managers or its affiliated companies an offer to buy or sell any investments, products or services, and should not be considered as solicitation or investment, legal or tax advice, a recommendation for an investment strategy or a personalized recommendation to buy or sell securities.
It has been established on the basis of data, projections, forecasts, anticipations and hypothesis which are subjective. Its analysis and conclusions are the expression of an opinion, based on available data at a specific date.
All information in this document is established on data made public by official providers of economic and market statistics. AXA Investment Managers disclaims any and all liability relating to a decision based on or for reliance on this document. All exhibits included in this document, unless stated otherwise, are as of the publication date of this document.
Furthermore, due to the subjective nature of these opinions and analysis, these data, projections, forecasts, anticipations, hypothesis, etc. are not necessary used or followed by AXA IM’s portfolio management teams or its affiliates, who may act based on their own opinions. Any reproduction of this information, in whole or in part is, unless otherwise authorised by AXA IM, prohibited.
AXA IM and BNPP AM are progressively merging and streamlining our legal entities to create a unified structure
AXA Investment Managers joined BNP Paribas Group in July 2025. Following the merger of AXA Investment Managers Paris and BNP PARIBAS ASSET MANAGEMENT Europe and their respective holding companies on December 31, 2025, the combined company now operates under the BNP PARIBAS ASSET MANAGEMENT Europe name.