

Shoot you down
There might be people shouting “I told you so” after US technology companies’ share prices fell sharply this week. It’s been building since the big players announced huge capital expenditure plans during their third quarter (Q3) earnings announcements. The core question is whether future artificial intelligence (AI) application demand will generate enough revenue to justify the money it is costing to build out the capacity that technology leaders believe is necessary. For now, it seems like a wobble. It doesn’t seem like it is macro driven. But, as always, what happens with interest rates will be key to investor sentiment as we head into 2026.
- Key macro themes – US labour market weakening in line with Fed forecasts
- Key market themes – Technology valuations correcting but theme remains strong
Cold weather, wobbly markets
Markets are wobbling. While history shows that November is typically a strong month for equity returns, that hasn’t been the case this year. The S&P 500’s year-to-date total return stood at 12.4% as of 20 November, compared to a previous year-to-date high of 18.4%. The setback is a reassessment of what is happening with AI’s build-out capacity and whether the vast amounts of spending will deliver sufficient future revenues to maintain the return on capital the big technology companies have been able to report in recent quarters. This is despite comforting revenue and earnings numbers reported by Nvidia earlier in the week. At some point tech company valuations - and the concentration they have generated in the market - were bound to undergo a setback. I am not sure this is the start of a “bubble” being burst, as the euphoria around AI remains undimmed, in terms of the need to build more data centres and cloud computing capacity to meet what is expected to be significant demand growth. But maybe investors are taking some profits and waiting for more realistic valuations levels. As my technology equity colleagues have highlighted in client meetings over the last couple of weeks, these stocks are volatile. Nvidia has undergone seven 50% corrections in its share price since it first went public. When valuations are built on very aggressive future earnings expectations, anything that questions the growth path can lead to big share price swings.
Fools gold
Profit taking might be a common theme in risk markets. Not only are equities off their highs (4.6% for the MSCI World, 7.8% for the Nasdaq Composite and 8.5% for the small cap Russell 4000) but gold has lost some of its shine and Bitcoin has undergone what can only be described as a collapse (33% below its recent high price versus the US dollar). However, credit markets are reasonably stable, with spreads only moving marginally higher in the cash bond and credit default swap derivatives markets. These moves have made credit look a little more attractive with, for example, the yield to worst on the US high yield index moving back slightly above 7.0%.
Christmas or New Year cut?
The delayed release of the US employment report for September hit the screens this week, showing a modest bounce in job creation (119,000 versus a 4,000 reduction in August) and another small increase in the unemployment rate to 4.4%. The data is not conclusive in determining what the Federal Reserve (Fed) will decide on interest rates at its 10 December meeting. Market expectations of a rate cut, based on swap market pricing, at are 30%, compared to 100% in mid-October. The Fed’s November meeting minutes suggest that several officials were of the mind to keep rates unchanged for the rest of the year.
3% still expected in 2026
The modest shift in rate cut expectations has been one of timing. The magnitude remains unchanged, with the Fed Funds Rate expected to be at 3.0% by end-2026. It’s worth considering the risks to this expected rate path. For starters, it is not clear the current state of the US economy warrants further cuts. The Fed has a dual mandate – targeting both inflation and unemployment. Chart one encompasses that. The vertical axis plots actual inflation relative to the Fed’s core personal consumption expenditure deflator target of 2.0% (a mark above zero means inflation is higher than target). The horizontal axis does the same for unemployment with the Congressional Budget Office’s estimate of unemployment rate that is consistent with stable inflation (a mark below zero means unemployment is below that rate, i.e. the labour market is tight). The marks on the chart reflect where the economy was at each time the Fed has reduced interest rates since 1995.
Don’t stop
Most rate cuts happen when inflation is below target or unemployment is above the NAIRU (non-accelerating inflation rate of unemployment), or both. The bottom right quadrant is classic recession territory. Today is not classic rate cutting territory. Inflation is above target, and the unemployment rate is in line – although it has been moving higher. Hence, the more cautious approach by Fed officials after already easing rates by 150 basis points since last September. The first few cuts were justified by policy being too tight. Now, that is not such a strong argument.
The last core PCE inflation data was for August showing a 2.9% year-on-year rate. The last consumer price inflation number was for September, showing core inflation at 2.6%. The last labour market report we had was for September when the unemployment rate was 4.4% (the same as the NAIRU estimate). On the face of it these are not numbers which easily justify a lot more easing.
Chart 1 – The Fed’s Dual Mandate and Rate Cutting History
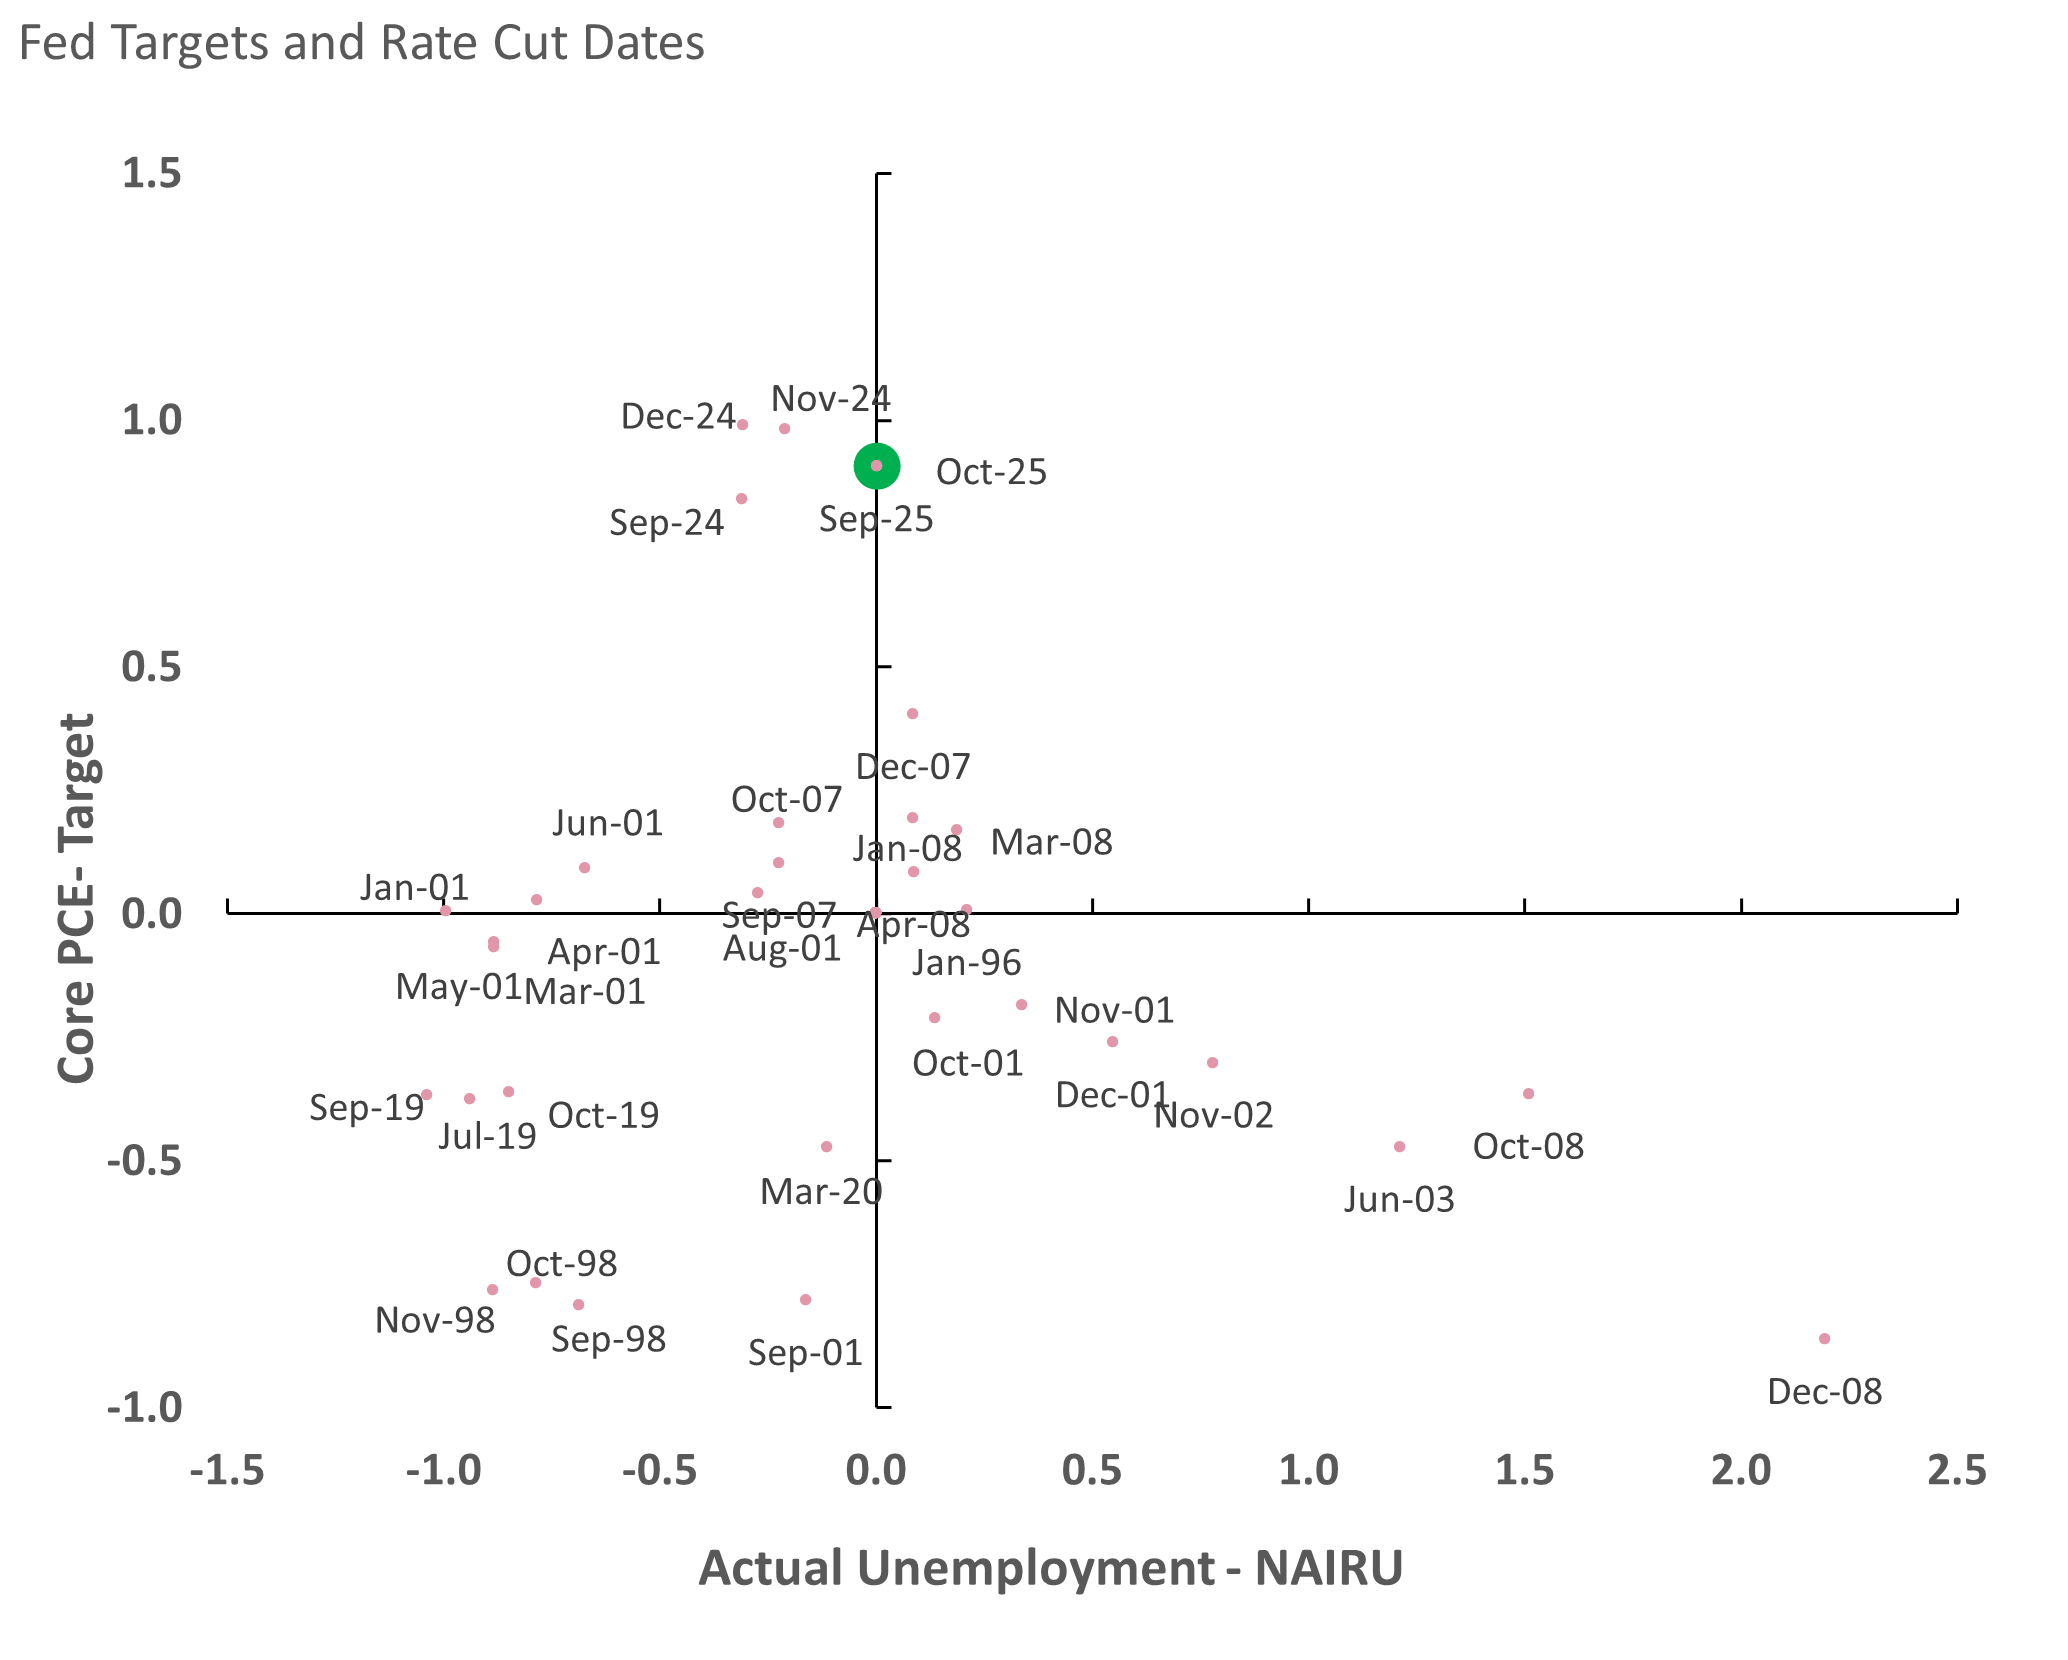
Source: Bloomberg; US Bureau of Labor Statistics; AXA IM CIO – November 2025
An observation from the chart is that the Fed rarely cuts rates if the unemployment rate is increasing, and inflation is above target (stagflation). If inflation does turn out to be more persistent, this might become a real concern for markets.
Forecasts
A critical analysis of the Fed might conclude there must be a strong expectation in the Fed’s forecasts that inflation will moderate, and unemployment will rise further if it cuts rates in line with market expectations. In the Fed’s September Summary of Economic Projections, the central forecast was for core PCE inflation to be between 2.4% and 2.7% in 2026 (still above target) and the unemployment rate to be between 4.4% and 4.5% (slightly above the current NAIRU estimate). The forecasts suggest decisions to keep on easing will be finely balanced given the existing differences of opinion at the Fed. Given that unemployment is at 4.4% already, it is likely to be the labour market that swings upcoming decisions.
Inflation bears
However, inflation is key given the observation above. I was at a conference in Europe recently where there was an overwhelming bias amongst participants that US inflation is going to rise. These expectations were based on tariffs, an expansionary fiscal policy and immigration policies sustaining higher wage growth. The same audience thought long-term US bond yields should be higher and the dollar weaker. By extension, the view was that the market was underestimating US inflation risks, with the inflation swaps market, for example, suggesting inflation will average just 2.5% over the next five years. If the real neutral interest rate is 1%, then a neutral Fed Funds Rate of 3.5% might be more appropriate than the 3.0% that is currently priced. Not a huge difference, but enough to have some impact on yields across the curve. If those conference bears are right – which I dispute - then rates will be higher on average.
Reasons to be easing
There are several arguments in support of current market pricing. First, inflation will fall meaningfully in 2026; second, the Fed will tolerate above target inflation if the labour market weakens further; third, it believes its current stance is still too tight given a weakening labour market; or fourth, political pressure (or fiscal dominance) becomes more influential on monetary policy, than strictly following the dual mandate.
Is policy tight?
In terms of where policy is, a form of the Taylor Rule would suggest the Fed is already at the correct level given where inflation and unemployment are today. To get to 3.0% on rates would require unemployment to be a lot higher and inflation lower – a recession in other words. So, is the Fed prepared to accept higher inflation? It seems like it, according to its own forecasts and the stated belief that the current elevated inflation risks are temporary (transitional). And we should not discount the influence of politics, with Chair Jerome Powell to be replaced in Q2 next year. President Donald Trump continues to criticise Powell, which doesn’t necessarily mean more rate cuts, but it muddies the decision-making process in the months ahead.
Market not prepared for an extended pause
The 3% terminal rate expectation is not a slam-dunk. It will be if the US goes into recession, or the unemployment rate moves further towards 5%. Let’s see when we get more data. If the tone is weak going into the New Year, then a January cut becomes more likely which will cement expectations of three further cuts next year. That will be supportive for the US Treasury market and bonds globally. However, if the data doesn’t move the dial that much on where the economy is relative to the dual mandate targets, the next rate cut could get moved back out to March or April, with a tendency for yields at to move higher as a result.
Having acknowledged risk, the Fed does not meet current expectations on rate cuts in the coming months – my view is the bond market is reasonably priced today. Treasury 10-year yields have averaged between 3.5% and 4.5% over the last 40 years. Core inflation has been around 2.4% and real GDP growth around 2.5%, giving an average nominal growth rate of 5%. We are not far from any of those long-term averages. Cyclically, there are downside risks to growth and employment and that should guide the Fed, on balance, to take rates towards the lower end of its historical range. If that means rates fall to 3% then, almost by definition, the US economy will be closer recession than the consensus thinks today. I am inclined to think there will be no recession and rates might bottom above 3.0%, compared to the argument that there will be a recession, and rates go to 3% or below. Either way, there is no reason for Treasury yields to radically move out of the established trading range. A recession makes sub-4% yields more likely, but there would need to be more of an inflation shock to push them above 5%.
Steady bonds help equities and credit
Bond market stability should be good news for other markets. Credit markets have shrugged off private market concerns while technology sector earnings were strong in Q3. In the long term, the AI theme might have a structural impact on bond yields (more borrowing by technology companies to fund the capacity roll-out followed by structurally higher real yields reflecting a higher level of trend productivity growth), but for now the causation is likely to be that stable bond yields are a tailwind for risk asset returns. The near term might be tricky but the consensus view is that equity returns will be strong again in 2026.
I am travelling to Japan next week and will be away during the UK Budget presentation. With Japan’s new Prime Minister Sanae Takaichi promising fiscal stimulus, and the market not convinced about UK fiscal policy credibility, I suspect my next note will focus on the long end of bond curves. As you know, I am not in the bond apocalypse camp and even more sympathetic about adding a little longer duration exposure today than was the case earlier in the year but am also sensitive to investor sentiment around government borrowing. With Japanese government bond yields at 1.7% and gilt yields at 4.6%, there are two quite different investment stories. I look forward to comparing them (as well as tucking into some delicious Japanese cuisine).
Made of Stone
This week saw sad news for Manchester and fans of indie rock music. The legendary bass guitar player and Manchester United fan – Gary “Mani” Mounfield - from the Stone Roses (and latterly Primal Scream) passed away at the age of 63. He was a founder member of the band which stands in the pantheon of Manchester music greats alongside Joy Division, The Smiths, and, in the eyes of some, Oasis. The Stone Roses’ eponymous debut album transformed British rock music and is in my all-time top 10 records. If you want a five-minute chill, have a listen to Fools Gold…you won’t be able to resist the groove! RIP Mani.
Performance data/data sources: LSEG Workspace DataStream, ICE Data Services, Bloomberg, AXA IM, as of 20 November 2025, unless otherwise stated). Past performance should not be seen as a guide to future returns.


Disclaimer
This document is for informational purposes only and does not constitute investment research or financial analysis relating to transactions in financial instruments as per MIF Directive (2014/65/EU), nor does it constitute on the part of AXA Investment Managers or its affiliated companies an offer to buy or sell any investments, products or services, and should not be considered as solicitation or investment, legal or tax advice, a recommendation for an investment strategy or a personalised recommendation to buy or sell securities.
Due to its simplification, this document is partial and opinions, estimates and forecasts herein are subjective and subject to change without notice. There is no guarantee forecasts made will come to pass. Data, figures, declarations, analysis, predictions and other information in this document is provided based on our state of knowledge at the time of creation of this document. Whilst every care is taken, no representation or warranty (including liability towards third parties), express or implied, is made as to the accuracy, reliability or completeness of the information contained herein. Reliance upon information in this material is at the sole discretion of the recipient. This material does not contain sufficient information to support an investment decision.
Issued in the UK by AXA Investment Managers UK Limited, which is authorised and regulated by the Financial Conduct Authority in the UK. Registered in England and Wales No: 01431068. Registered Office: 22 Bishopsgate London EC2N 4BQ
In other jurisdictions, this document is issued by AXA Investment Managers SA’s affiliates in those countries.
AXA IM and BNPP AM are progressively merging and streamlining our legal entities to create a unified structure
AXA Investment Managers joined BNP Paribas Group in July 2025. Following the merger of AXA Investment Managers Paris and BNP PARIBAS ASSET MANAGEMENT Europe and their respective holding companies on December 31, 2025, the combined company now operates under the BNP PARIBAS ASSET MANAGEMENT Europe name.