

Equity quarterly: Not so different
KEY POINTS
Assumptions at the beginning of the year that positive global economic growth, particularly in the US, would lead to continued equity market gains in 2026 have been challenged — first by February’s artificial intelligence-induced tumult, and then by the Iran war.
While GDP growth and inflation estimates have been revised (down and up, respectively), the outlook for equity markets has not necessarily changed all that much.
Earnings revisions so far this year have been positive for most major indices (see Exhibit 1), when they typically decline after beginning-of-the-year analyst optimism gives way to reality.
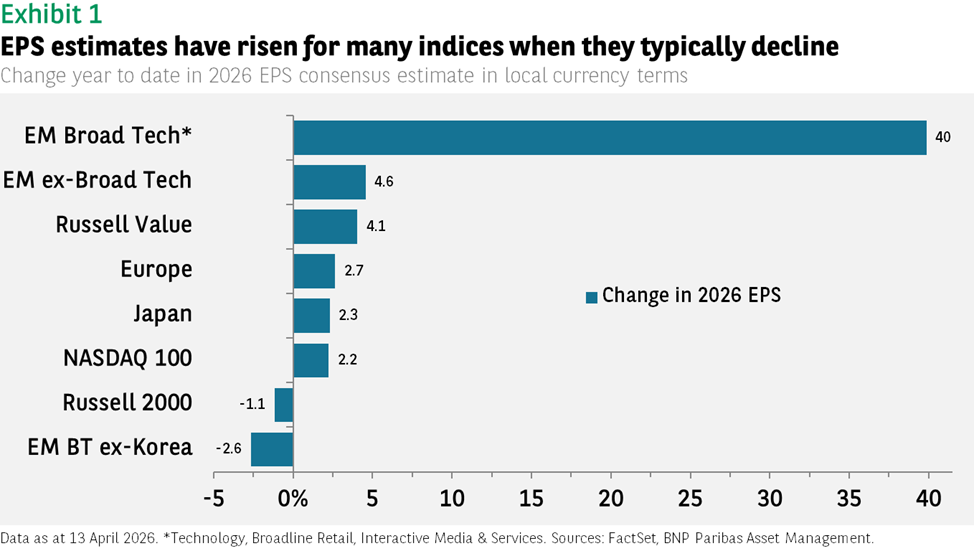
For the full year, earnings are expected to rise by anywhere from 11% (Japan) to 30% for the Nasdaq 100 and over 80% for emerging market technology stocks thanks to the surge in semiconductor sales.
While the gap between technology and non-technology-heavy markets remains substantial, it is nonetheless lower than in previous years and is forecast to narrow further next year.
US equities
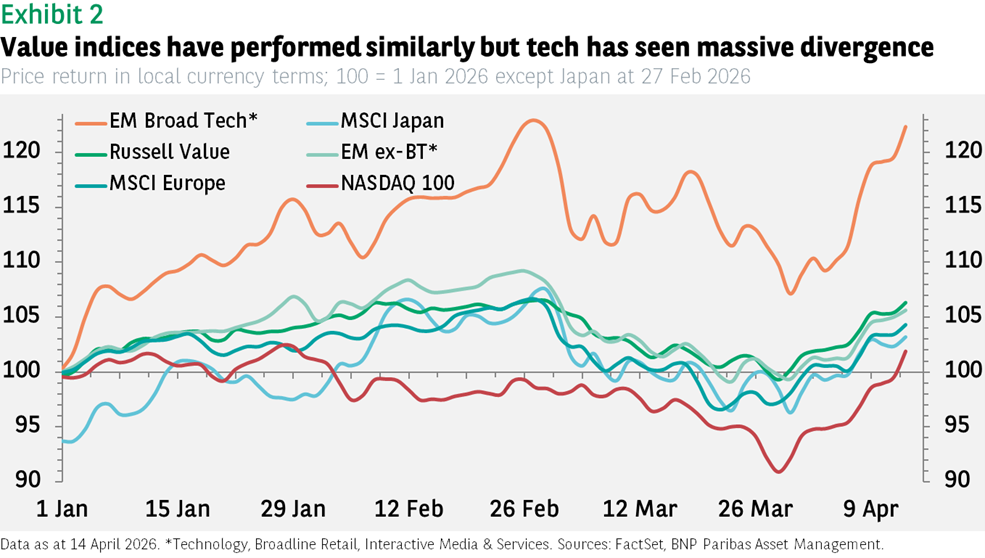
Global equity market performance so far in 2026 can be divided into three camps: the Nasdaq, emerging markets technology, and value indices (covering Japan, Europe, Russell Value, and emerging markets excluding technology).
Japan has outperformed the other value indices by about 5% year to date, but the outperformance was limited to the beginning of February after the Liberal Democratic Party’s election victory.
The most notable characteristic has been the wide divergence in returns between the Nasdaq and emerging market technology stocks. While a difference in returns is not surprising, to have one index up 20% while the other has just recently moved back into positive territory, is quite unusual (see Exhibit 2).
The cause is nonetheless well understood. During the first two months of the year Korean hardware stocks soared following the announcement by several large technology companies that they would significantly increase their AI-linked capital expenditure. Simultaneously, worries about the impact of exactly these AI technologies weighed on software stocks in the Nasdaq index. The important point is that this divergence is no longer evident (see Exhibit 3).
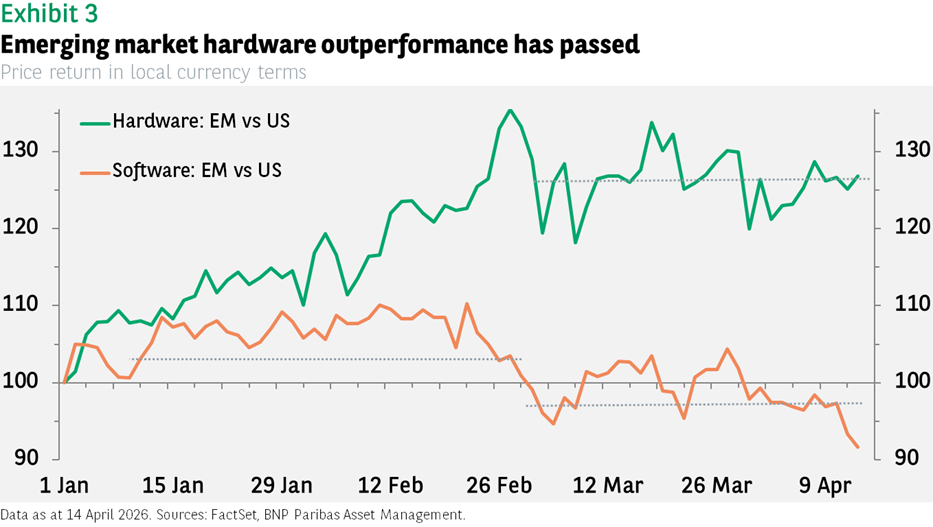
Software stocks in both regions performed mostly in line with each other, except around the time of the outbreak of the Iran war, when stretched positioning contributed to US outperformance.
For hardware stocks, now that the increase in earnings in emerging markets has been priced in, performance has similarly recoupled; returns since the recent market low on 30 March 2026 has been similar at 16%-19%.
As mentioned, the large gap in earnings growth expected for 2026 is also not expected to persist. Consensus estimates for 2027 are identical at 23% (still roughly twice the rate expected for the value indices). Consequently, one might expect positive but not widely dissimilar performance in the months ahead.
As for the Russell Value index, the outlook remains good, though any enthusiasm must be tempered by the disappointing fourth quarter US GDP data which showed growth of just 0.5%, a dramatic drop from the 4% average rate in the prior two quarters.
Even allowing for the US government shutdown drag, the 1.3% contribution from consumer demand (personal consumption expenditures) was well below the typical 2% rate. Higher petrol prices will not help. Moreover, business investment added just 0.3% to the headline figure, a third of the rate from earlier in the year.
Offsetting the downbeat data is encouraging labour market data (both positive job creation and a decline in the adult unemployment rate), and stronger core retail sales. Higher tax refunds should provide an additional boost to consumption.
Moreover, the weaker headline business investment in the GDP data masks what is still strong momentum for AI-related sectors, though much of that spending ends up going to imports of foreign-manufactured semiconductors, which tempers the benefit for the economy.
The reaction of the US Federal Reserve to the ongoing war in Iran will be critical. Our economists are looking for two additional cuts in the fed funds rate by the end of the year, while markets point to two fewer than was the case prior to the outbreak of the conflict. If we do see the reductions, both US small cap and tech stocks should benefit.
Europe: Plenty of potential
European equities have struggled through most of the year. Prior to the outbreak of the war, the MSCI Europe index lagged the other value indices (see Exhibit 2), and then fell further after the war started. The more positive mood (for now) in equities means that in the near term the index should potentially rebound more sharply.
A more hawkish European Central Bank is one challenge; expectations for the year-end level of the deposit rate have risen more in the eurozone than in the US. The ECB is prioritising containing inflation; it does not want to repeat the experience after Russia’s invasion of Ukraine, while the Fed is concentrating on the negative impact on growth of higher energy prices.
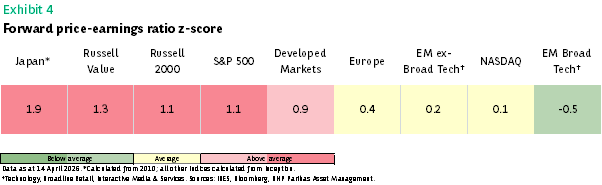
At an index level, the advantage of European equities is their more attractive valuations. Relative to other developed value markets, forward price-earnings ratios are not as high (see Exhibit 4). The reason for caution is that this discount has been in place for many years, but it has not led to sustained outperformance.
It is worth highlighting that relative multiples are lower for both US and emerging market technology stocks than they are for value-oriented markets.
Beyond the index level, investors may find potentially better opportunities leveraging from the region’s so-called strategic autonomy initiatives. Some of the beneficiaries, such as defence stocks, have clearly already reacted meaningfully, but we still see potential opportunities in other sectors such as technology and energy, to say nothing of small-cap stocks.
Emerging markets: Commodity exporters benefit
The increase in earnings expectations for technology hardware and semiconductor companies that began during the Q1 earnings season has not ended. Forward EPS estimates increased by over 30% in the first two months of the year; they have moved up another 20% since then. By contrast, software companies (mostly based in China) have seen estimates drop by 3%.
Broader macroeconomic data for China has also not been particularly encouraging. While some Purchasing Managers’ Indices showed a big jump in February, we believe the figures overstated the actual growth rate and the March readings were far more modest.
The long-standing challenges the economy faces (US tariffs, anaemic consumer sentiment and demand, moribund property market) remain, and the country’s reliance on oil imports from Iran poses another risk.
The increase in oil prices due to the Iranian war benefited emerging market commodity exporters. For example, the forward EPS for the MSCI Latin America index has risen at four times the rate over the last month as it did in February.
Oil prices will supposedly fall at some point but may well remain higher than they were prior to the conflict, providing sustained support to index prices.
Conclusion
Equity markets have perhaps shown surprising resilience to the energy shock so far. During the Gulf War in 1990, Brent oil prices rose by 85% compared to a nearly 80% gain we saw earlier this month, while the trough in the Dow Jones Industrials index was 17% below the pre-war level, more than twice the decline seen so far.
Changes in the energy intensity of many economies explains part of the difference, but there is also perhaps an implicit belief the war will not last much longer. The economic expansion we expected at the beginning of the year remains largely in place.
So far, the impact on corporate profit forecasts has been limited and we anticipate renewed gains in equity markets from here.


Disclaimer
This document is for informational purposes only and does not constitute investment research or financial analysis relating to transactions in financial instruments as per MIF Directive (2014/65/EU), nor does it constitute on the part of BNP PARIBAS ASSET MANAGEMENT Europe or its affiliated companies an offer to buy or sell any investments, products or services, and should not be considered as solicitation or investment, legal or tax advice, a recommendation for an investment strategy or a personalized recommendation to buy or sell securities.
Due to its simplification, this document is partial and opinions, estimates and forecasts herein are subjective and subject to change without notice. There is no guarantee forecasts made will come to pass. Data, figures, declarations, analysis, predictions and other information in this document is provided based on our state of knowledge at the time of creation of this document. Whilst every care is taken, no representation or warranty (including liability towards third parties), express or implied, is made as to the accuracy, reliability or completeness of the information contained herein. Reliance upon information in this material is at the sole discretion of the recipient. This material does not contain sufficient information to support an investment decision.
Issued in the UK by AXA Investment Managers UK Limited, which is authorised and regulated by the Financial Conduct Authority in the UK. Registered in England and Wales, No: 01431068. Registered Office: 22 Bishopsgate, London, EC2N 4BQ.
AXA IM and BNPP AM are progressively merging and streamlining our legal entities to create a unified structure
AXA Investment Managers joined BNP Paribas Group in July 2025. Following the merger of AXA Investment Managers Paris and BNP PARIBAS ASSET MANAGEMENT Europe and their respective holding companies on December 31, 2025, the combined company now operates under the BNP PARIBAS ASSET MANAGEMENT Europe name.