



















Is this the new (old) normal for government bond yields?
The sell-off in government bonds shows no signs of abating, even if the impetus for the rise in yields has changed.
Beginning with the most recent escalation in the Middle East at the beginning of August, rising oil prices correlated highly with government bond yields. The change in bond yields also drove returns for part of the equity market, that is, for non-technology sectors. Technology stocks were largely impervious to the moves.
From 4 August to 1 October, the 10-year US Treasury yield gained over 60 basis points. The non-tech parts of the MSCI All Country World Index (ACWI) dropped by 8%, while the tech sector gained 9% (see Exhibit 1).
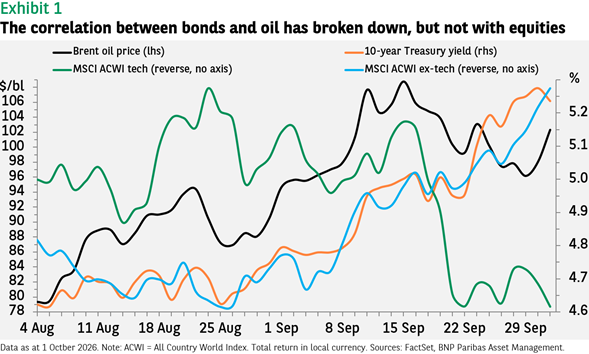
The lack of correlation between tech stocks and interest rates is unusual. If anything, tech stocks are more correlated with yields than non-tech stocks as tech earnings are generally further out in the future, and the impact is greater on the net present value of a stock’s price due to a higher discount rate.
The reason yields have mattered less recently is that the earnings momentum behind technology stocks is overwhelming the interest rate effect.
The significance of oil as a driver of bond yields, however, has waned over the last few weeks. The Brent oil price peaked recently at nearly $109 before dropping back to $96 (it’s risen again since). Over the period when the price was falling, US Treasury yields rose by 25 basis points.
The primary reason for the increase has been better-than-expected US economic growth data (with a bit of French debt sustainability risk on top). The latest Purchasing Managers’ Indices were strong. Second quarter GDP was revised from a (below trend) 1.5% to an (above trend) 2.2%.
This acceleration in growth comes as US inflation remains above target, so it raises the risk of overheating and the prospect for more hikes in the fed funds rate than the market has priced in.
How bad can it get?
There is likely a limit to how much higher US growth estimates can go. Eventually, the impact on inflation would force the Federal Reserve to raise rates to slow down the economy. Debt worries, however, could spread beyond France if the situation there deteriorates. Oil prices could certainly rise further.
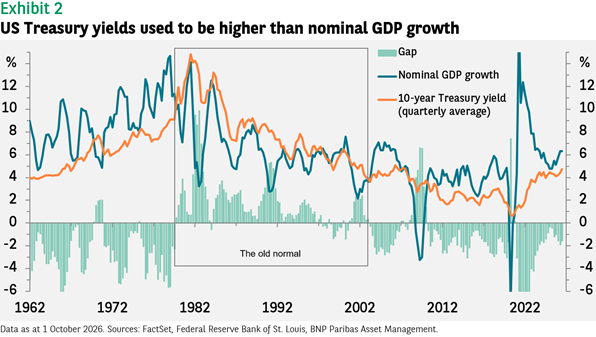
But by one simple measure, interest rates are not necessarily all that high. US nominal GDP growth in the second quarter was 6.3% and the latest Atlanta GDPNow forecast for the third quarter points to a similar pace.
From the 1980s through to the bursting of the dot com bubble, 10-year Treasury yields were typically higher than nominal GDP growth. It was only with the 2001 US recession, the global financial crisis, quantitative easing and Covid that yields were consistently below (though it was also the case in the 1960s and 1970s; see Exhibit 2).
The 1980s and 1990s were a period of good economic growth that also saw the arrival of the internet. To the degree it has parallels with the current environment and the rollout of artificial intelligence, what is happening today could be a partial normalisation of the government bond market. In which case, US Treasury yields above 5% may be more likely than yields below 5%.
There are significant differences, however, between the two periods, most notably the level of US government debt. It averaged 44% in the earlier period compared to 110% today. The amount of money the government has to devote to paying interest on this debt, as a share of its budget, is nonetheless lower today than the 20% it represented in 1980s and 1990s.
If yields were to rise somewhat more from here, it would likely still be nowhere near as brutal as the increase in yields in 2022. This is not to suggest it would not be a difficult adjustment for some parts of the market (just look at the recent increase in US high yield credit spreads), but a return to the 1980s to 1990s 'normal' might not be so problematic.
Why isn’t the oil price lower?
Headlines tell us that the flow of oil through the Strait of Hormuz has nearly recovered to pre-war levels and the worst-case scenarios for the Bab el-Mandeb Strait have not materialised, yet oil prices remain around $100 per barrel. The view is that the market price reflects the average of two divergent scenarios. If oil flows fully normalised, one would expect the price to drop towards $70 per barrel as it did during the previous lull in the conflict in late March.
The alternative scenario, however, could see sharply higher prices. If Iran concludes that it has lost control of the Strait of Hormuz, one option would be to resume attacks on its oil producing neighbours to pressure the US. Time will tell which scenario prevails.



Disclaimer
This document is for informational purposes only and does not constitute investment research or financial analysis relating to transactions in financial instruments as per MIF Directive (2014/65/EU), nor does it constitute on the part of BNP PARIBAS ASSET MANAGEMENT Europe or its affiliated companies an offer to buy or sell any investments, products or services, and should not be considered as solicitation or investment, legal or tax advice, a recommendation for an investment strategy or a personalized recommendation to buy or sell securities.
Due to its simplification, this document is partial and opinions, estimates and forecasts herein are subjective and subject to change without notice. There is no guarantee forecasts made will come to pass. Data, figures, declarations, analysis, predictions and other information in this document is provided based on our state of knowledge at the time of creation of this document. Whilst every care is taken, no representation or warranty (including liability towards third parties), express or implied, is made as to the accuracy, reliability or completeness of the information contained herein. Reliance upon information in this material is at the sole discretion of the recipient. This material does not contain sufficient information to support an investment decision.
Issued in the UK by AXA Investment Managers UK Limited, which is authorised and regulated by the Financial Conduct Authority in the UK. Registered in England and Wales, No: 01431068. Registered Office: 22 Bishopsgate, London, EC2N 4BQ.
AXA IM and BNPP AM are progressively merging and streamlining our legal entities to create a unified structure
AXA Investment Managers joined BNP Paribas Group in July 2025. Following the merger of AXA Investment Managers Paris and BNP PARIBAS ASSET MANAGEMENT Europe and their respective holding companies on December 31, 2025, the combined company now operates under the BNP PARIBAS ASSET MANAGEMENT Europe name.