

US investment grade credit bounces back from its nadir
KEY POINTS
In his 1974 children’s book, The Tiger’s Bones, the English poet Ted Hughes wrote that “Nothing is free. Everything has to be paid for.”
Looking at the healthy state of the US corporate credit market today - the jewel in the crown of the global credit universe - one could be forgiven for forgetting about the heavy price paid by all fixed income assets to get to this point.
Today, parallels can be drawn between the time Hughes was writing in the mid-1970s and the impact of spiralling inflation on financial markets. The recent inflationary spike - to levels not witnessed since the 1970s - and the Federal Reserve’s (Fed) subsequent aggressive pace of policy tightening saw the ICE BofA US Corporate Index suffer consecutive negative return years in 2021 and 2022 for the first time since records began in 1973.
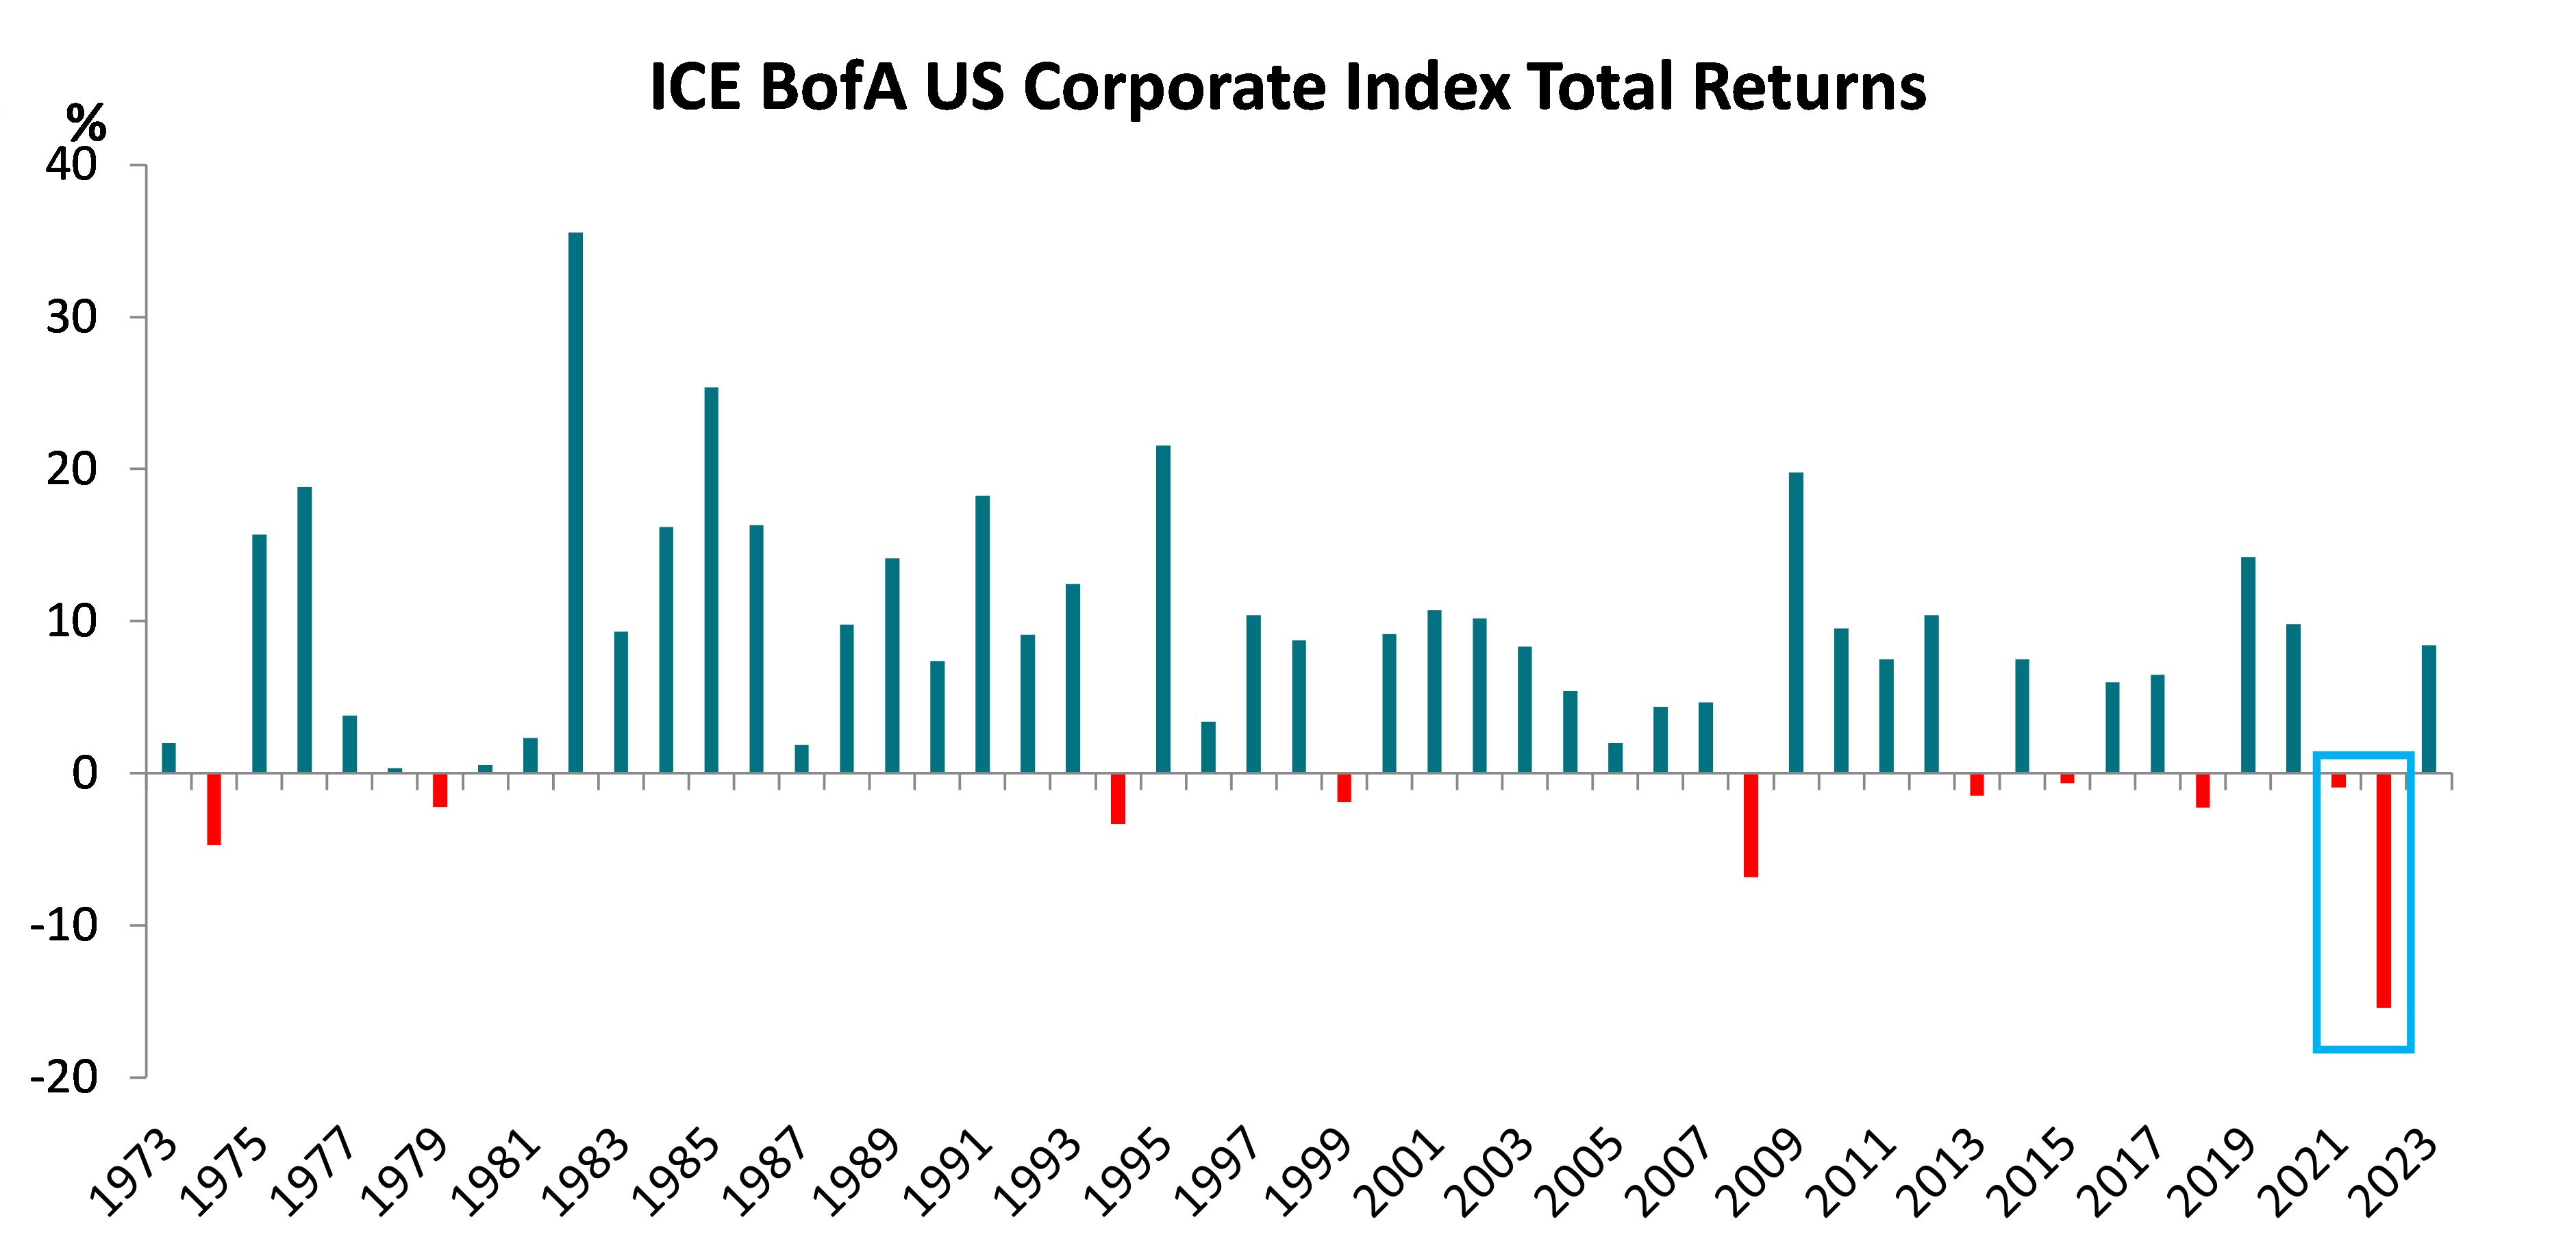
Source: ICE BofA as at 31 December 2023
However, as the chart above demonstrates, not only are negative years relatively rare in credit, but the market tends to bounce back following a downturn as coupons reset at higher levels and income takes over once more in driving returns.
In a little over two years, the broad market’s average par-weighted coupon has risen by 58 basis points (bp), and it should continue to rise significantly as more companies come to refinance old debt put in place during the post-global financial crisis years of low interest rates and low yields.
Yields move to 15-year high
Today, the flip side of the negative returns experienced in 2021-2022 is that investors can now access the US IG credit market at attractive all-in yields of 5.8%, levels not seen since 2009.
Underpinning this quandary are the laws of economics, which dictate that rate hiking cycles of the magnitude recently witnessed should lead to a slowdown in activity, an easing in the labour market and potentially even a full-blown recession.
At this phase of the cycle, companies may struggle to cope as lending standards tighten through a combination of spiralling interest costs and declining demand for their products and services, leading to negative operating trends and a pick-up in downgrades to high yield (HY) and bankruptcies.
Credit spreads would typically widen in these periods to reflect the additional risk being felt by the corporate sector above the risk-free rate. But there has been nothing typical about the resilience and continued exuberance of corporate America in response to the current squeeze in conditions, reflected by credit spreads which have continued to surprise investors by grinding tighter.
Adjusting to a new norm
Although there have been some headline-grabbing pockets of weakness within the US regional banking sector and commercial real estate, which continues to attract concern, US investment-grade company earnings have broadly held up well, despite some notable misses. Overall company profitability
Margins within most sectors have also stabilised and even improved for higher-quality issuers after a period of deterioration. Sticky inflation led to increased costs without revenues keeping pace but as inflation moderates, pricing action and efficiency measures undertaken by IG companies in the past two years should drive margin improvement.
Turning to the primary market, many companies took advantage of very low rates in 2020-2021 to refinance debt and lock in low interest expense costs on long maturity bonds. These two years saw a wave of new issuance totalling $3.8trn of debt across the US IG credit market, primarily used for refinancing purposes. This combined total was 51% higher than the previous two-year total of 2018-2019. As a result, comparing the end of 2018 with 2021, the market’s average maturity increased from 10.4 years to 11.8 years – its highest point since 1999.
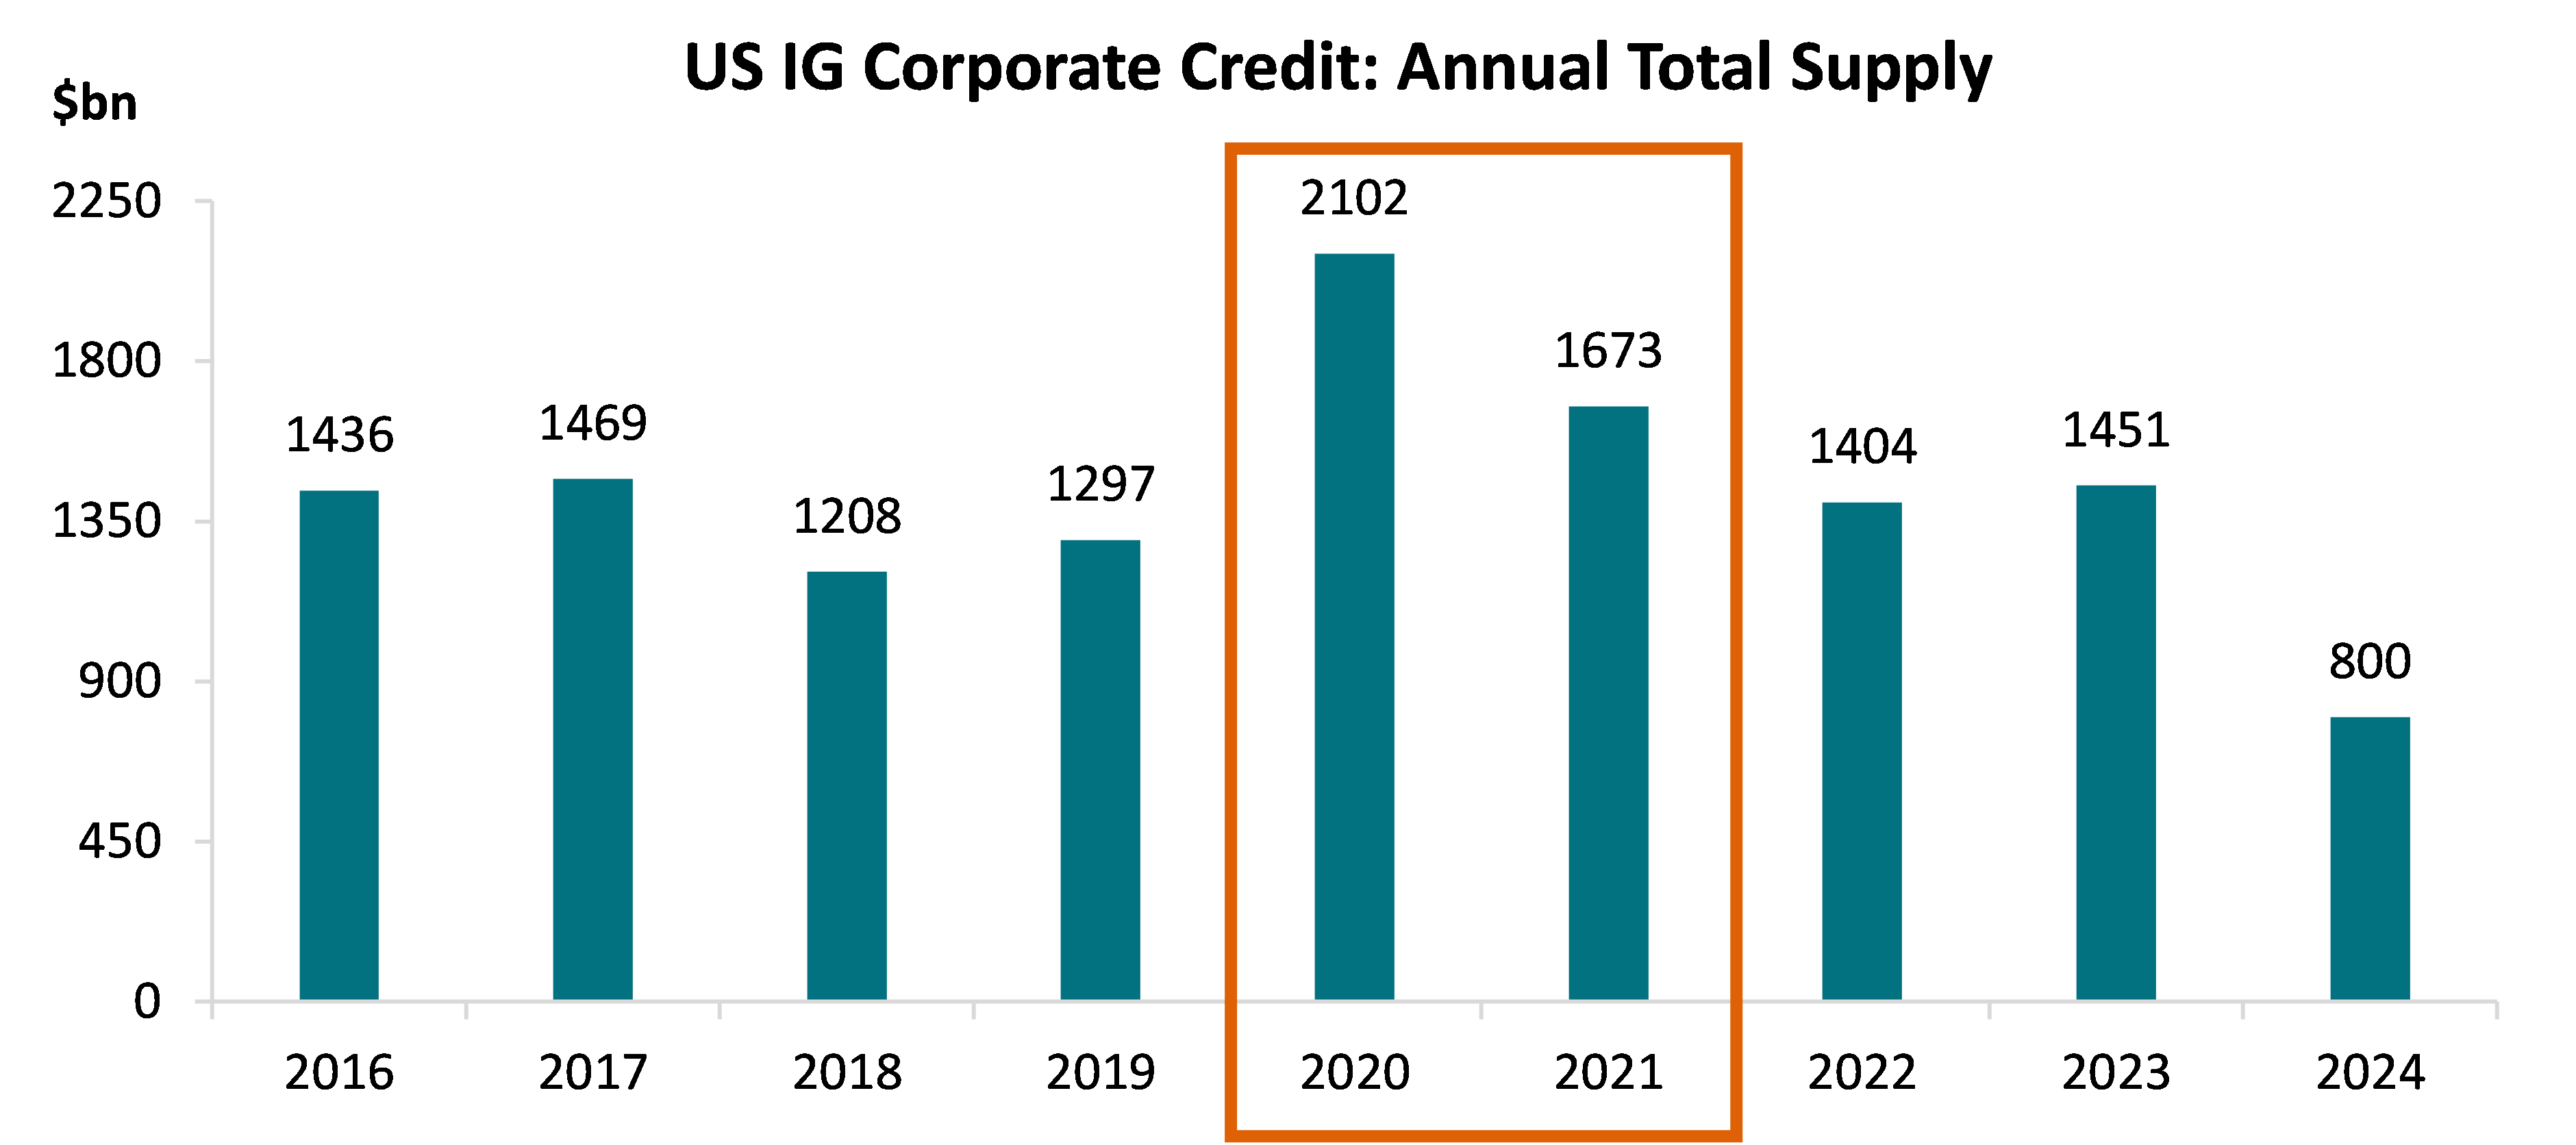
Source: Barclays Live Report 30 April 2024
For an asset class like US credit, which has a longer duration than its European counterpart and less callability than high yield (meaning more bonds are retired at their original maturity date), the proactivity of companies in adjusting their capital structures while rates were low has afforded them time to adjust to this period of higher rates. The fact the new issue market has remained active even as rates have been going up is testament to the buffer that many companies have to stomach some additional interest expense after the bumper years of 2020-2021. US companies’ large balance sheet cash reserves have helped them manage their debt profiles comfortably.
This can also be attributed to overall leverage remaining at manageable levels, with many companies entering this higher rate period having used the large cash piles built up during 2020-2021 to pay down debt. Now that quantitative easing (QE) is no longer keeping a virtual ceiling on how high yields can go, management teams have the real incentive to keep leverage low so that the overall interest burden today is not so much higher than when rates were low.
Their relative success in doing so is supported by interest coverage ratios, which have deteriorated from a peak in the second half of 2022, given the burden of increased interest expense coupled with mild profitability decline, but not to concerning levels that most IG companies can’t deal with. Overall coverage ratios remain higher today compared to the end of 2019, although disciplined credit selection is warranted to weed out the companies unable to adapt to these shifting currents.
Technical tailwinds
After such a strong run, primary market forecasts are, on average, down for 2024 as companies grapple with higher borrowing costs. That said, there continues to be robust demand for high quality credit, meaning that even as supply in 2024 continues to exceed expectations, the market is not struggling to absorb current volumes. This in turn is providing technical support and playing a significant offsetting role in limiting any impact on spreads from higher rates.
Perhaps the largest form of technical support has been from the strong ratings momentum across the full credit continuum. Last year saw a record upgrade volume in the US IG market of $791bn (11% of market size), which included $101bn of rising stars from HY of which Ford, the largest rising star ever, accounted for 40%. Downgrades totalled $225bn (3%), of which just $25bn fell to HY. This equated to an upgrade/downgrade ratio of 3.5 times, well above the past 15-year average of 1.1 times.
Although we expect 2024 to be more balanced in terms of ratings trends, the market is entering this period from strength in terms of credit quality with just 46% in BBBs – the lowest it has been since 2016.
At the same time, higher income potential and expectations of a peak in the Fed Funds Rate have driven investors back to high quality credit, with nearly $200bn of inflows into US IG credit in 2023 (split evenly between exchange-traded funds and mutual funds) and continued demand in 2024 as investors look to deploy cash from the high inventories built up over recent years.
This is testament to the power of the yield buyers who, despite tight spreads, are attracted to the potential total return that the asset class now offers.
Dawn after dark
While the fundamental and technical picture looks healthy, the biggest tailwind of all would come from the macro story and Fed cuts, which remain very much on the table for 2024 despite sticky inflation. Fed cuts would initiate a decline in short-term deposit rates and create better entry points for spread buyers. A potential steepening in the yield curve after persistent inversion would also present more attractive opportunities further out along the curve.
Risks remain on both sides if the economy is weaker or stronger than expected, while the higher-for-longer environment could drive a more pronounced deterioration in interest coverage ratios, which needs to be carefully monitored through active fundamental research.
Meanwhile, the market is starting to look through the current impasse, recognising that although the price has been high, the potential for attractive total returns from high-quality credit is now back.
Read more on the US

US cements itself as the global centre of tech innovation

Will the US presidential election endanger an investment boom?

Central banks and their impact – the role of the Fed.

Driving impact: Why the US represents a hive of opportunity for sustainable investors

US exceptionalism: Can the world’s largest economy keep delivering for investors?

Forget the politics: Why election uncertainty won’t, and shouldn’t, put investors off the US


Disclaimer
This document is for informational purposes only and does not constitute investment research or financial analysis relating to transactions in financial instruments as per MIF Directive (2014/65/EU), nor does it constitute on the part of AXA Investment Managers or its affiliated companies an offer to buy or sell any investments, products or services, and should not be considered as solicitation or investment, legal or tax advice, a recommendation for an investment strategy or a personalized recommendation to buy or sell securities.
Due to its simplification, this document is partial and opinions, estimates and forecasts herein are subjective and subject to change without notice. There is no guarantee forecasts made will come to pass. Data, figures, declarations, analysis, predictions and other information in this document is provided based on our state of knowledge at the time of creation of this document. Whilst every care is taken, no representation or warranty (including liability towards third parties), express or implied, is made as to the accuracy, reliability or completeness of the information contained herein. Reliance upon information in this material is at the sole discretion of the recipient. This material does not contain sufficient information to support an investment decision.
Issued in the UK by AXA Investment Managers UK Limited, which is authorised and regulated by the Financial Conduct Authority in the UK. Registered in England and Wales, No: 01431068. Registered Office: 22 Bishopsgate, London, EC2N 4BQ.
In other jurisdictions, this document is issued by AXA Investment Managers SA’s affiliates in those countries.
© 2024 AXA Investment Managers. All rights reserved
AXA IM and BNPP AM are progressively merging and streamlining our legal entities to create a unified structure
AXA Investment Managers joined BNP Paribas Group in July 2025. Following the merger of AXA Investment Managers Paris and BNP PARIBAS ASSET MANAGEMENT Europe and their respective holding companies on December 31, 2025, the combined company now operates under the BNP PARIBAS ASSET MANAGEMENT Europe name.