

Decarbonising portfolios: Are institutional investors delivering on their climate objectives?
- Many asset owners are setting portfolio-level net zero emissions targets with the aim of contributing to the goals of the Paris Agreement
- As investors move from goal setting to measuring success, attention has turned to the factors that are driving portfolio decarbonisation
- There are four key factors that will impact portfolio carbon emissions, only one of which – reducing absolute emissions – will help to deliver net zero
We have seen an explosion of interest in climate-aware and Paris Agreement-aligned portfolios over the last few years. Investors have set objectives ranging from mitigating climate risks and reducing fossil fuel exposures all the way to targeting net zero by 2050. While there are several ways to aim for the goals of the Paris Agreement,
We think this approach is suitable for asset owners that have set mandate-level decarbonisation targets. However, it can be adapted for use at total portfolio level across a range of asset classes and there is no need to have a decarbonisation target to undertake this analysis and take advantage of the insights it can offer.
Setting portfolio decarbonisation objectives
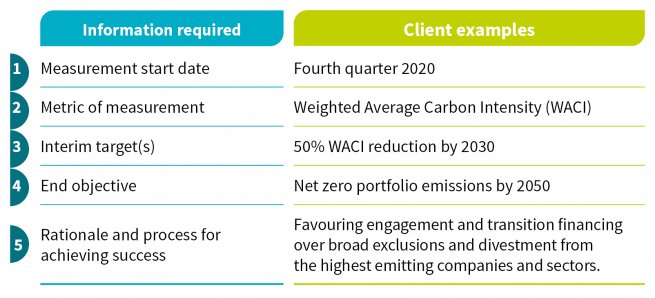
Many of our clients have set, or are looking to set, decarbonisation targets in the portfolios we manage on their behalf. To set these goals, just five pieces of information are required, set out below and illustrated with real-world examples from our work with a large pension fund client. This client has set a total portfolio objective of achieving net zero by 2050 and is looking to ensure their underlying portfolios are helping to achieve this goal:
Once an objective is set, we can look at how it can be measured. Carbon intensity is heavily skewed towards the highest emitting issuers and sectors, as might be expected. For example, just 5% of a typical global credit portfolio can contribute 50% of the portfolio’s emissions. These high emitters are usually found in the energy, utility and basic materials sectors. By excluding these names, asset owners can quickly and easily decarbonise a portfolio. However, this simply moves the problem to another, potentially less responsible, asset owner and is unlikely to lead to worldwide decarbonisation. Our view tends towards the longer term, and we see value in seeking verifiable sustainable progression in the assets we hold.
‘Real’ decarbonisation?
That raises a key question: How can asset owners review whether portfolio decarbonisation has occurred through sales or through ‘real’ issuer-level decarbonisation?
To monitor progress against decarbonisation objectives we have created an emissions ‘waterfall’ which attributes the change in carbon intensity from one period to the next into the different factors listed below:
- New data/coverage – Each year, more issuers release their carbon emissions data publicly and this new information will impact the carbon intensity of a portfolio. New data from low emitters should reduce portfolio carbon intensity, and vice versa.
- Change of asset allocation – Portfolio turnover, new portfolio flows and any cashflow distributions will alter the asset allocation of the portfolio which then impacts the carbon intensity. Selling out of the highest emitting names will show up in this factor.
- Change in absolute emissions – This factor is the ‘real’ decarbonisation as it measures the emissions changes of the underlying issuers held in a portfolio. This is the primary driver of achieving net zero in the wider world.
- Changes in revenues – To calculate carbon intensity you divide absolute emissions by issuer revenues. Therefore, an increase in revenues will decrease portfolio carbon intensity, even if absolute emissions do not change. Similarly, a decrease in revenues, for example during a period of economic crisis, would increase portfolio carbon intensity.
- Residual – The residual factor is common in any attribution analysis and is the difference between the above factors and the total change in WACI. We would expect this to be small in absolute terms and not a material contributor to portfolio emissions changes.
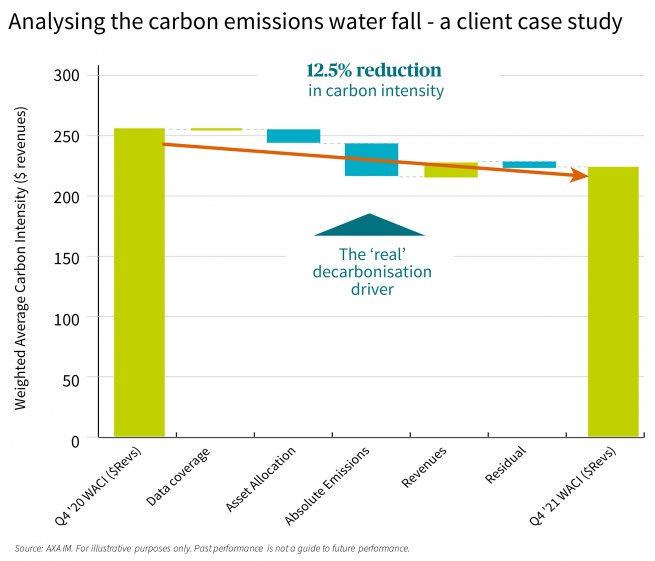
In the client example above, the WACI reduced by 12.5% over the year. The main driver of this (-11%) was the fall in absolute emissions from a handful of large emitters within the portfolio. Interestingly, revenues for some high emitters were lower than the previous year, which increased the carbon intensity (+5%). The sale of one high-emitting issuer owing to our concerns over their plans to build a new coal plant resulted in a 5% drop in WACI. Overall, this 12.5% reduction and the key drivers of the change are broadly in line with our expectations, and we believe at a pace aligned to the goals of the Paris Agreement.
How might these factors change?
- New data: We expect coverage to increase over the coming years but then have a minimal impact on year-on-year emissions changes thereafter. The inclusion of some Scope 3 data and thereafter increasing coverage and accuracy of Scope 3 data will be a factor to consider in the future.
- Asset allocation: While this factor should not be a material contributor to portfolio decarbonisation, if high emitters do not decarbonise in line with expectations, asset owners should have a plan of action ready. For example, AXA IM has a “three strikes” policy which we may use to divest from such names, and the resulting reduction in intensity would be reflected in this category.
- Absolute emissions: Issuer carbon emissions data is released on an annual basis and using this new data, we can calculate the change in absolute emissions for each issuer. This factor is heavily influenced by the highest carbon intensity names and therefore careful monitoring of these names is crucial. Low-emitting names have a negligible impact of absolute emissions reductions.
- Revenues: Although reducing absolute emissions is the ultimate goal in the decarbonisation journey, the world still needs economic growth. Therefore, if an issuer can produce more, and therefore earn higher revenues with the same carbon emissions, this can be considered a small success.
Active engagement with issuers is increasingly important to achieve decarbonisation objectives. It impacts each of the above factors, through building more resilient revenues, encouraging issuers to release more reliable emissions data and driving meaningful reductions in their absolute emissions. It enables portfolios managers to remain invested in transitioning companies and maintain a broad investible universe.
We note that the above case study has been done at mandate/portfolio level and can be applied at a total portfolio level as well by adding a further asset allocation factor into the calculation which accounts for any changes in the strategic asset allocation at the total portfolio level.
While this attribution provides the key drivers in portfolio decarbonisation over a period, as ever, the devil is in the detail. Drilling into each of the factors and the rationale for any large increases or decreases in carbon emissions at both the issuer- and portfolio-level will be the most useful exercise to assess the quality of portfolio decarbonisation. We expect our client meetings to focus more on this type of analysis now that a number of years of carbon emissions data is available for portfolios.

Our Institutional Offering
We are an active, long-term and responsible partner for our clients. Our goal is to deliver an offering for pension funds and insurers that meets their varied requirements for sustainable, risk-adjusted returns.
Find out moreDisclaimer
This document is for informational purposes only and does not constitute investment research or financial analysis relating to transactions in financial instruments as per MIF Directive (2014/65/EU), nor does it constitute on the part of AXA Investment Managers or its affiliated companies an offer to buy or sell any investments, products or services, and should not be considered as solicitation or investment, legal or tax advice, a recommendation for an investment strategy or a personalized recommendation to buy or sell securities.
Due to its simplification, this document is partial and opinions, estimates and forecasts herein are subjective and subject to change without notice. There is no guarantee forecasts made will come to pass. Data, figures, declarations, analysis, predictions and other information in this document is provided based on our state of knowledge at the time of creation of this document. Whilst every care is taken, no representation or warranty (including liability towards third parties), express or implied, is made as to the accuracy, reliability or completeness of the information contained herein. Reliance upon information in this material is at the sole discretion of the recipient. This material does not contain sufficient information to support an investment decision.
Past performance is not a guide to current or future performance. The value of investments, and the income from them, can fall as well as rise and investors may not get back the amount originally invested. Exchange-rate fluctuations may also affect the value of their investment. Due to this and the initial charge that is usually made, an investment is not usually suitable as a short-term holding.
Information concerning portfolio holdings and sector allocation is subject to change and, unless otherwise noted herein, is representative of the target portfolio for the investment strategy described herein and does not reflect an actual account. Portfolios may differ as a result of client-imposed investment restrictions, the timing of client investments and market, economic and individual company considerations.
Representative Accounts have been selected based on objective, non-performance based criteria, including, but not limited to the size and the overall duration of the management of the account, the type of investment strategies and the asset selection procedures in place. Therefore, the results portrayed relate only to such accounts and are not indicative of the future performance of such accounts or other accounts, products and/or services described herein. Account performance will vary based upon the inception date of the account, restrictions on the account, along with other factors, and may not equal the performance of the representative accounts presented herein.
AXA IM and BNPP AM are progressively merging and streamlining our legal entities to create a unified structure
AXA Investment Managers joined BNP Paribas Group in July 2025. Following the merger of AXA Investment Managers Paris and BNP PARIBAS ASSET MANAGEMENT Europe and their respective holding companies on December 31, 2025, the combined company now operates under the BNP PARIBAS ASSET MANAGEMENT Europe name.