US reaction: US payrolls in ground hog day surprise
KEY POINTS
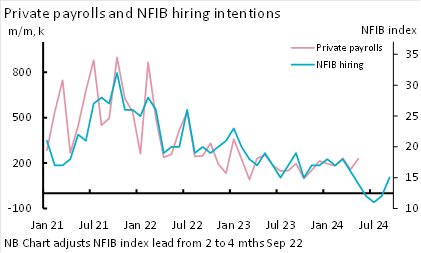
Not for the first time, we open today’s reaction with the words “Payrolls once again defied ours and market expectations”. Headline payrolls in May rose by 272k, marginally faster than the 267k average expansion over Q1. However, this was materially stronger than the 180k consensus (and our own forecast for a weaker 150k) and the downward revised 165k (from 175k) posted last month. The 3-month trend rose to 249k. Part of the increase was due to a partial rebound in government employees, those rising by 43k in May from just 7k in April, although somewhat softer than the 60k average of the previous five quarters. However, the real surprise was in the marked rise in private payrolls to 229k from 158k. This defied consensus forecasts for 165k, the 34k decline in the ADP survey and the drop suggested by the NFIB survey that has proven a remarkably good guide to private payrolls over the past 3 years (Exhibit 1).
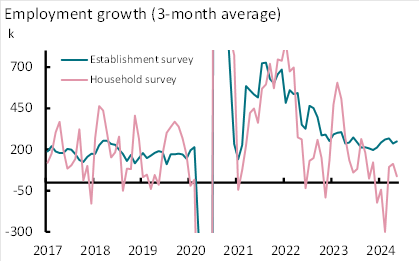
A broader view of May’s employment report starts to ask broader questions. First, the household survey measure of employment fell by 408k – its biggest one-month drop since December. We have highlighted the divergence in the two measures previously and the current divergence in trend is not as great as it has been in the past (Exhibit 2). Moreover, we argue that this series is being affected by the impact of significant immigration not yet fully captured in Census Bureau population estimates. And we know that this series is more volatile. However, the household survey captures elements that the Establishment survey only estimates in its companies births/deaths factor at this stage.
This drop pushed the unemployment rate up to 4.0% - its highest since January 2022. This was despite the fact that labour force was estimated to have contracted by 0.15% on the month, its sharpest fall this year – despite continued evidence of strong immigration into the US. This in turn reflected a 0.2ppt drop in participation to 62.5% - its joint lowest since January 2023. At 4.0% the unemployment rate is 0.6ppt higher than its latest low 13-months ago. However, the change is 0.37ppt higher in the three month average trends used to calculate the Sahm effect, which has historically been used to identify recession. Relatedly, we note that quite apart from the fall in May’s labour force, labour supply growth has been decelerating from an average annual 1.7% in 2023 to just 0.5% now. This looks questionable in the face of alternative immigration numbers that have continued to increase sharply.
Finally and perhaps most importantly, total average hourly earnings rose by more than expected, up 0.4% on the month in May (compared to a 0.3% expectation), while non-supervisory earnings rose by 0.47%, taking annual rates up to 4.1% and 4.2% respectively. The 3-month annualized rate of total earnings rose back to 4.1% in May, from the 3½ year low of 3.0% last month. We argue that 4.1% is not far from the pace consistent with the Fed’s 2% inflation target, but it is likely above it and still modestly too elevated for the Fed to consider a serious argument to loosen monetary policy just yet.
Taken in the round, today’s payrolls report raise more questions than answers and have displayed some volatile moves in most key areas. The Establishment Survey has continued to come in stronger than expected and although we continue to expect a weakening in the months ahead and hold out some expectation of downward revision to today’s preliminary figure, we do so with less conviction than before. The Household Survey remains weak, both in employment and in labour supply terms, but we acknowledge that this survey is inherently more volatile and we think impacted by population estimates. And pay growth has surprised modestly to the upside. We do not think this will have a major impact on next week’s FOMC meeting, but if anything it will urge more patience before easing policy, serving more to keep the FOMC in an uncommitted, “data dependent” mode. We expect the FOMC’s dots next week to shift to two cuts for this year and maintain our own outlook of two cuts in September and December.
Short-term rate markets reacted to the release, pricing for a September rate cut jumped from 85% this morning to 60%, with expectations for two cuts pared back to 60% from over 90%. As such, 2-year Treasury yields jumped 13bps to 4.84% and 10-year yields 12bps to 4.41%, undoing most of the steady gains Treasuries have made this week. The dollar also rose by 0.7% against a basket of currencies.
Exhibit 1: Private payrolls posts surprise gain

Source: BLS, June 2024
Exhibit 2: Divergence between two measures persists, but not at extreme

Source: BLS, June 2024
Disclaimer
This document is for informational purposes only and does not constitute investment research or financial analysis relating to transactions in financial instruments as per MIF Directive (2014/65/EU), nor does it constitute on the part of AXA Investment Managers or its affiliated companies an offer to buy or sell any investments, products or services, and should not be considered as solicitation or investment, legal or tax advice, a recommendation for an investment strategy or a personalized recommendation to buy or sell securities.
It has been established on the basis of data, projections, forecasts, anticipations and hypothesis which are subjective. Its analysis and conclusions are the expression of an opinion, based on available data at a specific date.
All information in this document is established on data made public by official providers of economic and market statistics. AXA Investment Managers disclaims any and all liability relating to a decision based on or for reliance on this document. All exhibits included in this document, unless stated otherwise, are as of the publication date of this document.
Furthermore, due to the subjective nature of these opinions and analysis, these data, projections, forecasts, anticipations, hypothesis, etc. are not necessary used or followed by AXA IM’s portfolio management teams or its affiliates, who may act based on their own opinions. Any reproduction of this information, in whole or in part is, unless otherwise authorised by AXA IM, prohibited.
Issued in the UK by AXA Investment Managers UK Limited, which is authorised and regulated by the Financial Conduct Authority in the UK. Registered in England and Wales No: 01431068. Registered Office: 22 Bishopsgate London EC2N 4BQ
In other jurisdictions, this document is issued by AXA Investment Managers SA’s affiliates in those countries.
© AXA Investment Managers 2024. All rights reserved
AXA IM and BNPP AM are progressively merging and streamlining our legal entities to create a unified structure
AXA Investment Managers joined BNP Paribas Group in July 2025. Following the merger of AXA Investment Managers Paris and BNP PARIBAS ASSET MANAGEMENT Europe and their respective holding companies on December 31, 2025, the combined company now operates under the BNP PARIBAS ASSET MANAGEMENT Europe name.


