



















What’s the meaning of the emerging market tech stock sell-off?
The primary beneficiary of the artificial intelligence capital expenditure boom has been emerging market technology hardware and semiconductor stocks, particularly in Korea.
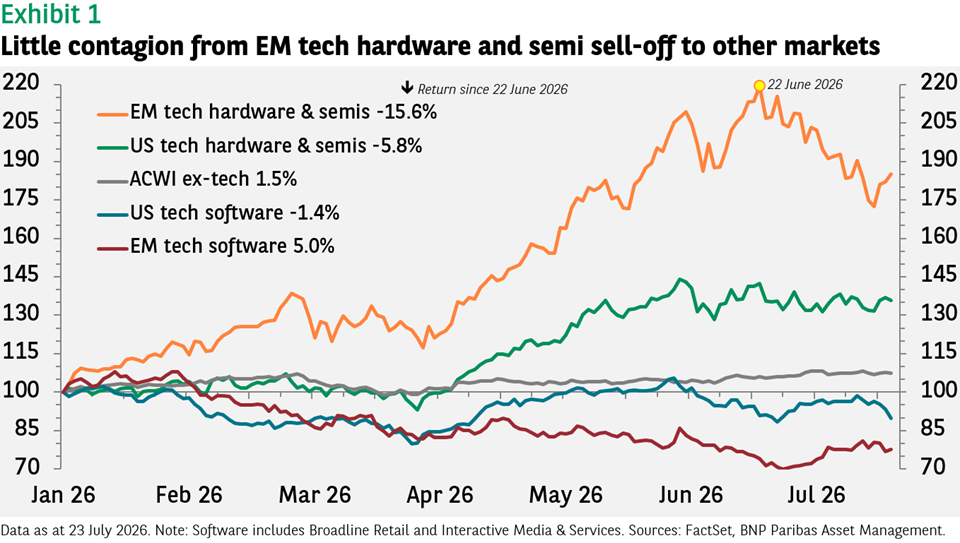
At their peak this year, an index of these stocks had advanced nearly 120% since the beginning of 2026 (for Korea it was over 250%). The recent 15.6% drop has reduced the year-to-date return to ‘just’ 85%.
There has been comparatively little contagion to other markets. US hardware and semiconductor stocks have fallen 5.8% over the last few weeks but are still up 36% year to date.
US software stocks have weakened a bit, but globally, non-tech stocks have seen modest gains, despite rising interest rates and renewed conflict in the Middle East (see Exhibit 1).
What goes up must come down?
The dramatic drop in EM tech stocks has understandably raised questions about whether the AI bubble is bursting. We are of the view that the sell-off is more technical than fundamentally driven. Given the large increase both in stock prices and in earnings for the sector, above-average volatility was to be expected.
Foreign investors have been selling Korean equities since February, according to data from the Korean Stock Exchange, likely prompted by a desire to rebalance portfolios and take profits. The redemptions accelerated in May and June, contributing to the depreciation of the won over the period.
Individual Korean investors, however, have been willing buyers of the shares being sold. US-domiciled ETFs, meanwhile, have had inflows all year (except for May) and July’s flows are already higher than they have been for any month this year.
One factor that has been suspected of contributing to the depth of the market’s decline has been the popularity of leveraged ETFs.
Providing the opportunity to investors to double their gains (or losses) in a market that has already doubled in value can understandably be seen as a sign of excessive (if not necessarily irrational) exuberance.
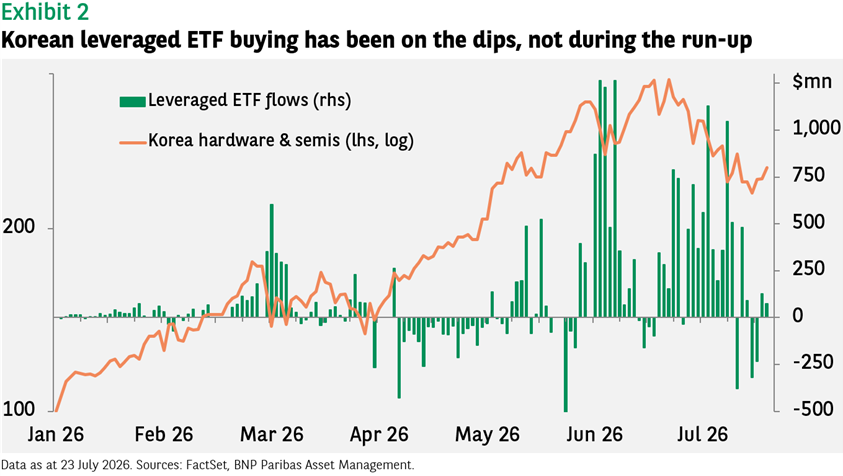
While the funds have proved popular, with assets under management reaching $33 billion at their peak, it is not obvious that they were behind the swing in investor sentiment.
During the big run-up in the stocks, which began at the end of March, flows were negative. The inflows have primarily come during market sell offs, like the one in March after the start of the Iran war, and the two in June (see Exhibit 2).
The continued decline in the market in July shows that fund flows do not determine market direction, but they do suggest many investors still see prospects of a recovery in share prices.
The primary risk to the market would be any indication that capex was fading. In fact, the opposite seems to be the case. The recent decline in Alphabet’s price following its earnings release was partly due to the company’s plans to increase capex spending despite the company’s results beating expectations.
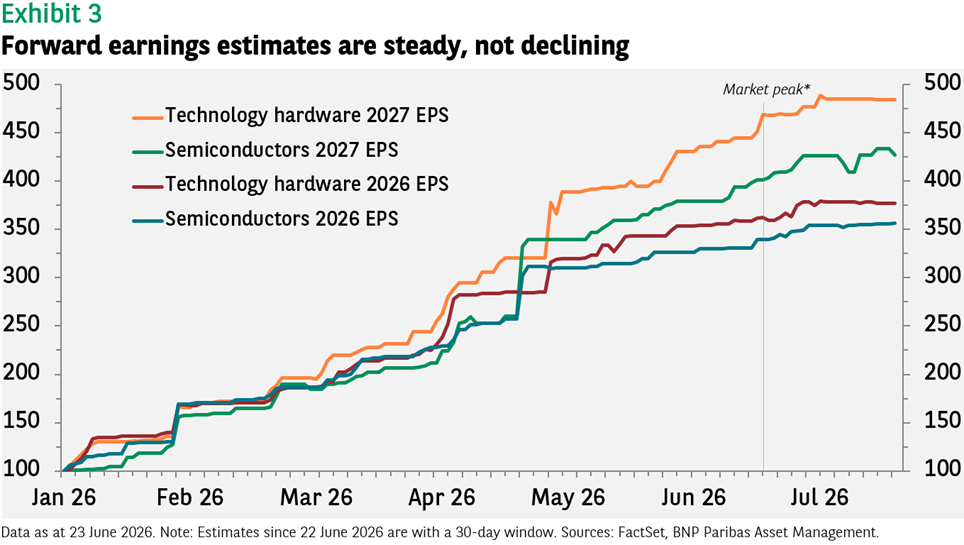
Moreover, one does not see a downturn in analyst profit expectations. Since the market’s peak in late June, earnings expectations have been steady (including only those estimates changed or verified over the last 30-days - see Exhibit 3).
Given announcements for increased capex spending from the hyperscalers, we would expect estimates for 2027 to move up again. The impact on 2026 forecasts may be less due to production constraints.
Another potential catalyst for the sell-off is valuations, though high valuations by themselves rarely provoke a market correction in the absence of another factor.
At late-June’s market peak, the MSCI Emerging Markets Technology Hardware & Equipment index’s forward price-earnings ratio was 11.3 times compared to a long-run average of 13.9, that is, P/Es were below average even then and are even lower now.
For the semiconductor index, P/Es were above average (15.8 times vs. 13.6), but today they are 14.2, giving a z-score (standard deviation from the mean) of just 0.3. Given the growth prospects for the sector, that does not seem ‘excessive’, let alone irrational.
Data sources: FactSet, BNP Paribas Asset Management as of 24 July 2026 (unless otherwise stated). Past performance should not be seen as a guide to future returns


Disclaimer
This document is for informational purposes only and does not constitute investment research or financial analysis relating to transactions in financial instruments as per MIF Directive (2014/65/EU), nor does it constitute on the part of BNP PARIBAS ASSET MANAGEMENT Europe or its affiliated companies an offer to buy or sell any investments, products or services, and should not be considered as solicitation or investment, legal or tax advice, a recommendation for an investment strategy or a personalized recommendation to buy or sell securities.
Due to its simplification, this document is partial and opinions, estimates and forecasts herein are subjective and subject to change without notice. There is no guarantee forecasts made will come to pass. Data, figures, declarations, analysis, predictions and other information in this document is provided based on our state of knowledge at the time of creation of this document. Whilst every care is taken, no representation or warranty (including liability towards third parties), express or implied, is made as to the accuracy, reliability or completeness of the information contained herein. Reliance upon information in this material is at the sole discretion of the recipient. This material does not contain sufficient information to support an investment decision.
Issued in the UK by AXA Investment Managers UK Limited, which is authorised and regulated by the Financial Conduct Authority in the UK. Registered in England and Wales, No: 01431068. Registered Office: 22 Bishopsgate, London, EC2N 4BQ.
AXA IM and BNPP AM are progressively merging and streamlining our legal entities to create a unified structure
AXA Investment Managers joined BNP Paribas Group in July 2025. Following the merger of AXA Investment Managers Paris and BNP PARIBAS ASSET MANAGEMENT Europe and their respective holding companies on December 31, 2025, the combined company now operates under the BNP PARIBAS ASSET MANAGEMENT Europe name.