

Diversifying US equity exposures through small-cap companies
Investing in US companies with a small market capitalisation can provide distinct benefits over exposure to large and mid-caps: small caps are often at the forefront of innovation and in early stages of the growth cycle. Traditionally, small-cap companies are also more exposed to the shape of the domestic economy: they typically operate in local markets rather than international ones.
That is not to say that they are impervious to political developments such as trade policies. Initially, there were concerns in markets and business over the effects of the Trump tariffs on the US economy. These have now given way to hopes over the prospects of deregulation, still lower interest rates, and tax cut extensions. This setup should benefit small and medium-sized companies, as should investment incentives, businesses reshoring, more lending by banks, and lower barriers to mergers and acquisitions.
The small-cap equity market segment – and with it, small-cap indices – is usually more diversified than their large-cap counterparts. As a point in case, the MSCI USA Small Cap index covers more than 1,500 companies compared to only around 550 in the broad MSCI USA index.
More limited exposure to tech
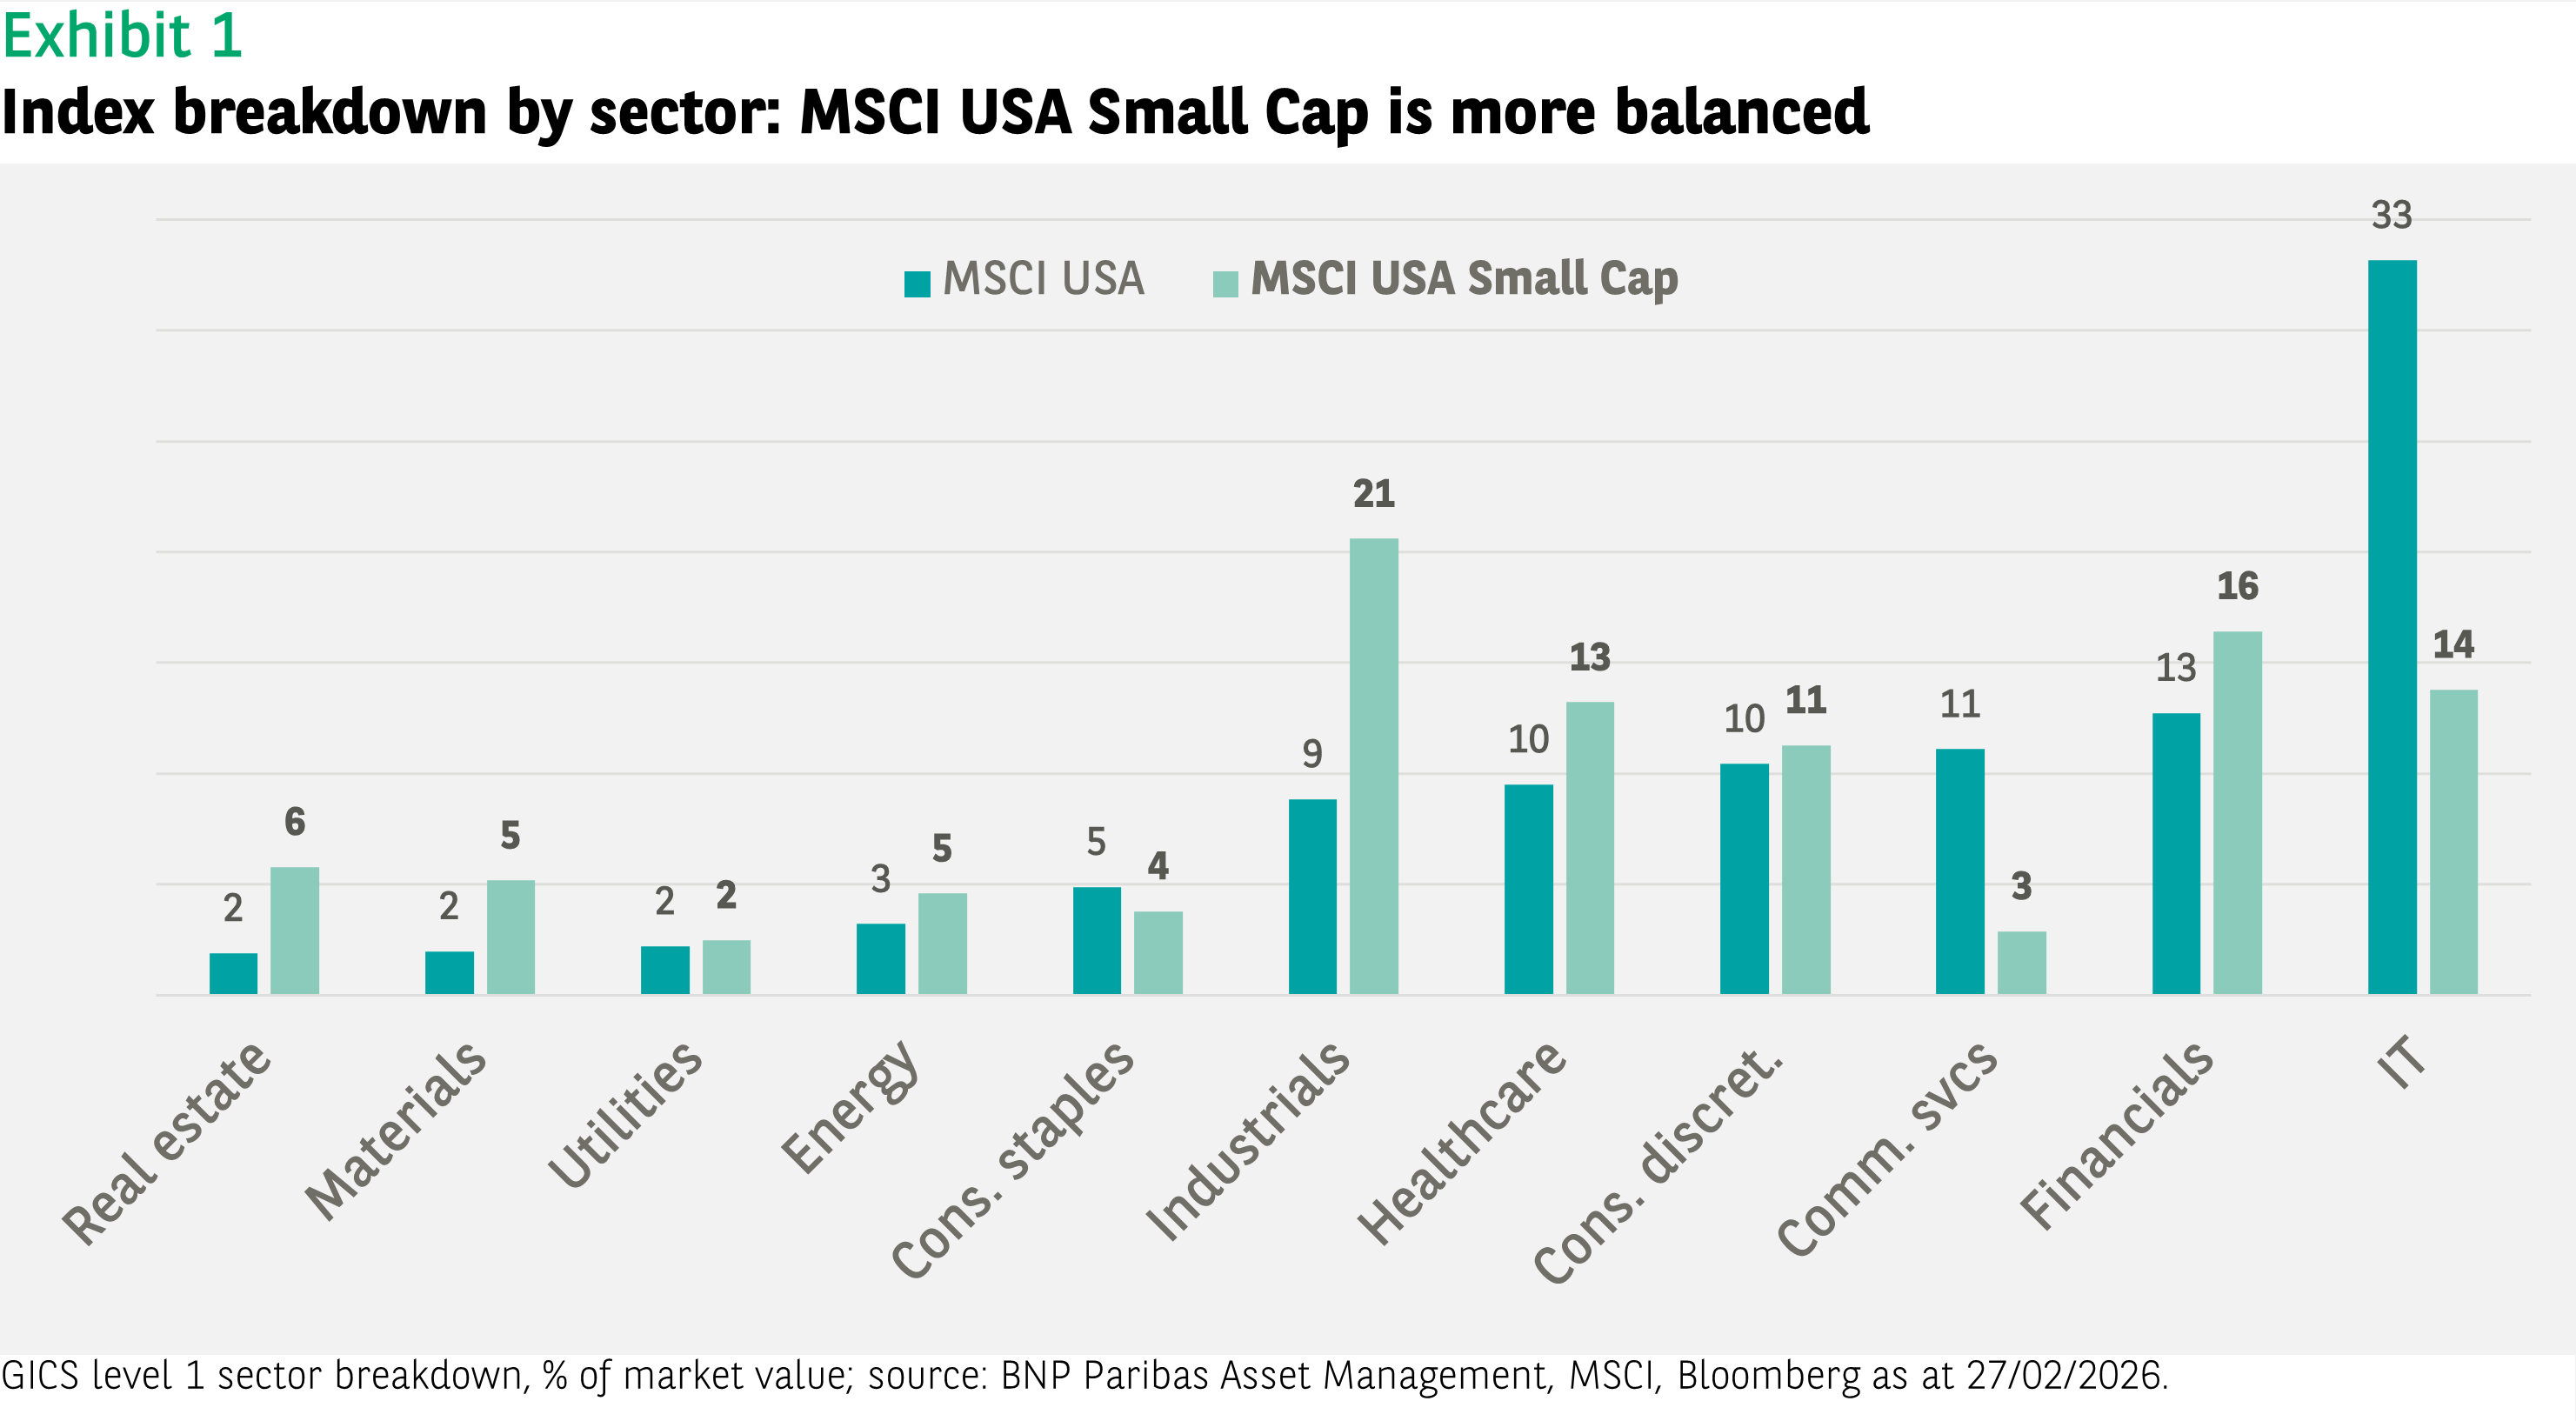
US small-cap indices tend to have a more balanced allocation to business sectors. Thus, the exposure to the technology sector, where we have seen a growing concentration of large and mega-cap companies in recent years (see Exhibit 1), is much more limited.
The heavy presence of the top 10 in large-cap indices reflects the impressive performance of the Magnificent 7 in recent years: the top 10 accounts for around 40% of the MSCI USA index, where in the small-cap index, their cumulative weight is only around 4%.*
With such a sizeable weight, the largest companies have been the main performance drivers of US large-cap indices: the top 10 contributed 50-60% to index returns in 2024 and 2025. In comparison, the top 10 contribution to the performance of the MSCI USA Small Cap index was only around 15% in 2025.*
Index construction and passive small-cap exposure
When looking at passive exposures to US small-cap stocks, it is important to understand the exact definition of the investment segment. Across index providers, the stocks selected can vary significantly. The difference in definition is also true for large and mid-cap indices, but as those indices nowadays tend to be concentrated in the mega caps, the impact is not as significant.
As an example, the overlap between the MSCI USA and the S&P 500 is more than 95% in terms of market value; it is a still high 89% for the MSCI USA Large Cap and the S&P 500. However, the overlap is only 25% between the MSCI and S&P small-cap indices, or 45% for the MSCI and FTSE Russell ones.*
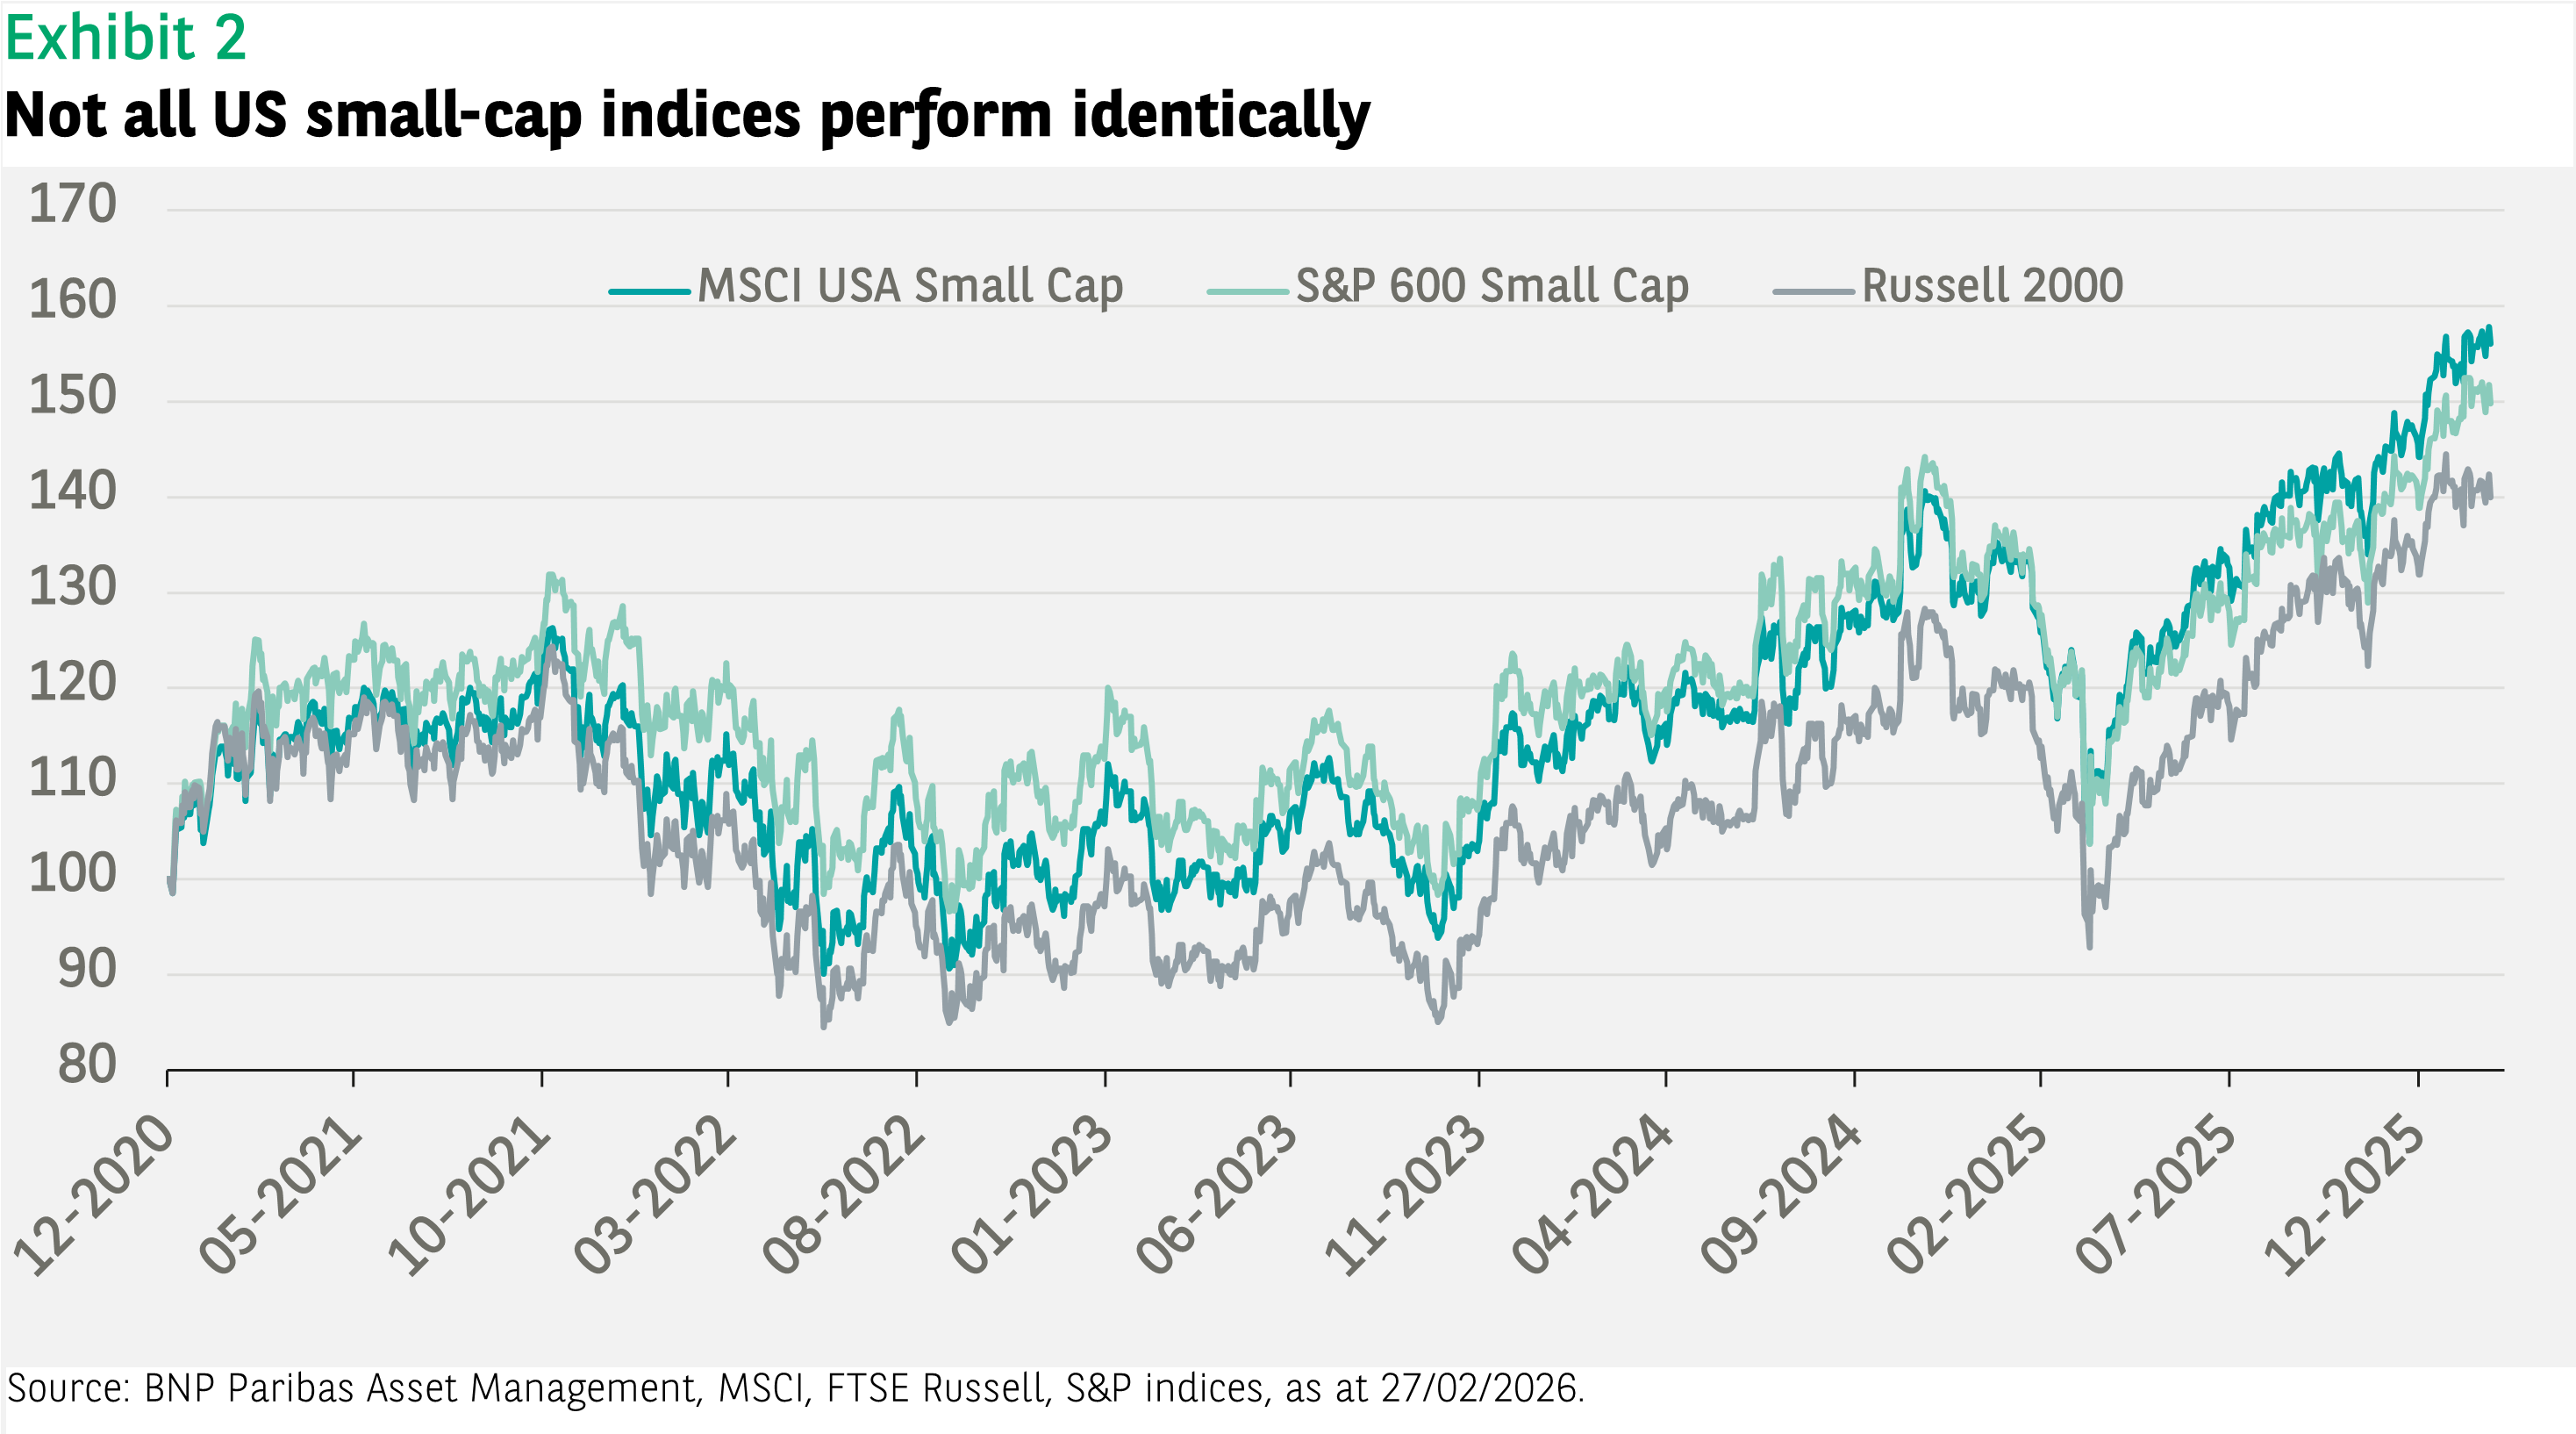
Despite showing similar behaviours, the performance of indices can diverge significantly (see Exhibit 2). For example, in the last 12 months the MSCI and Russell indices had comparable returns (roughly 23%), while the S&P index returned only around 17%.
The limited overlap and the differences in performance lead to a higher tracking error of small-cap indices compared to traditional large and mid-cap US equity benchmarks. This shows the importance of looking carefully at the definition of the universe when choosing a small-cap index.
Embedding ESG in US small-cap exposure
Above, we discussed the merits of considering a US small-cap passive exposure as well as the importance of the universe definition across index providers. One additional consideration is the integration of environmental, social and governance factors. Indeed – just as with large-cap indices – ESG integration can be done in various ways in a US small-cap universe; it can also influence performance depending on how it is implemented.
Here, we look at the MSCI Select Filtered min TE methodology. This embeds ESG considerations in three main aspects*:
- Value-based exclusions and restrictions: companies involved in any of the below businesses are excluded – fossil fuel extraction thermal coal power, controversial weapons, tobacco production*
- ESG score improvement: the weighted average ESG score of the MSCI Select Filtered Min TE index is at least equal to the ESG score of the parent index after removal of the 10% worst ESG rated companies
- Carbon intensity reduction: greenhouse gas intensity is at least 20% lower than that of the parent index (including scope 1+2+3 GHG emissions).
The weights of the index constituents are determined using an optimisation process that aims at minimising the ex-ante tracking error against the parent index. This process embeds constraints including the carbon intensity and ESG score improvements mentioned above, but also criteria for the maximum deviations from the parent index at a sector, country and issuer level to make the ESG index as representative as possible versus mainstream small-cap exposures.
In the case of US small-cap exposure, embedding ESG considerations leaves 1,411 out of 1,628 constituents of the parent index in the MSCI Select Filtered Min TE universe. Incorporating these factors raises the industry-adjusted ESG score from 5.7 to 6.0, while the carbon intensity of the index falls from 519 tCO2e/$M EVIC* to 422. The effect on the tracking error is limited: 0.55% for one-year ex-post weekly returns and 0.50% on an ex-ante basis.
ESG – Limited impact on performance
Despite better ESG metrics, the performance differences versus the mainstream index are minimal, and the volatility is almost identical. The MSCI USA Small Cap Select Filtered Min TE index appears to offer a similar portfolio profile compared to the parent index in terms of performance and breakdown with a contained tracking error.
Indicators such as the ESG score and carbon intensity can be improved on top of excluding controversial businesses and severe controversies (in line with UN Global Compact principles). We can conclude that the MSCI USA Small Cap Select Filtered Min TE index is an additional tool to integrate ESG considerations into passive portfolios, while maintaining similar features compared to mainstream exposures.
*Data sources: BNP Paribas Asset Management, Bloomberg, MSCI as of 27/02/2026, unless mentioned otherwise. For detailed index rules, refer to the MSCI methodology document on www.msci.com. The ESG score is the MSCI Industry adjusted ESG score, using a weighted average for scope 1, 2 and 3 carbon emissions intensity; tCO2e/$M EVIC – normalised for enterprise value including cash; unit used: tons of CO2 per $ million enterprise value


Disclaimer
This document is for informational purposes only and does not constitute investment research or financial analysis relating to transactions in financial instruments as per MIF Directive (2014/65/EU), nor does it constitute on the part of BNP PARIBAS ASSET MANAGEMENT Europe or its affiliated companies an offer to buy or sell any investments, products or services, and should not be considered as solicitation or investment, legal or tax advice, a recommendation for an investment strategy or a personalized recommendation to buy or sell securities.
Due to its simplification, this document is partial and opinions, estimates and forecasts herein are subjective and subject to change without notice. There is no guarantee forecasts made will come to pass. Data, figures, declarations, analysis, predictions and other information in this document is provided based on our state of knowledge at the time of creation of this document. Whilst every care is taken, no representation or warranty (including liability towards third parties), express or implied, is made as to the accuracy, reliability or completeness of the information contained herein. Reliance upon information in this material is at the sole discretion of the recipient. This material does not contain sufficient information to support an investment decision.
Issued in the UK by AXA Investment Managers UK Limited, which is authorised and regulated by the Financial Conduct Authority in the UK. Registered in England and Wales, No: 01431068. Registered Office: 22 Bishopsgate, London, EC2N 4BQ.
AXA IM and BNPP AM are progressively merging and streamlining our legal entities to create a unified structure
AXA Investment Managers joined BNP Paribas Group in July 2025. Following the merger of AXA Investment Managers Paris and BNP PARIBAS ASSET MANAGEMENT Europe and their respective holding companies on December 31, 2025, the combined company now operates under the BNP PARIBAS ASSET MANAGEMENT Europe name.