



















Global equity outlook: A tale of two markets
KEY POINTS
US exceptionalism was supposed to be last year’s theme. 2026 was all about balance and broadening of growth across countries. That vision has not quite played out. From an economic point of view, the US continues to outpace other major economies.
The huge gap in artificial intelligence capital expenditure in the US (estimated to be around $755 billion this year by Goldman Sachs) compared to China (around $100 billion) and Europe (approximately 5% of the US spend, according to Morgan Stanley) explains much of the difference.
The latest US GDP figures show a significant ongoing contribution to growth from business investment (partly offset by a net export drag due to semiconductor purchases from abroad), and solid consumer demand.
Europe, by contrast, has suffered more from the Iran war energy shock, with the services sector falling into contractionary territory in many countries. The impact of the European Union’s strategic autonomy initiative is being felt more slowly than expected. Growth has nonetheless remained resilient and improving economic surprises should boost investor sentiment.
China is benefiting from AI-linked exports, but continued weakness in the property sector and consumer demand resulted in just 3.6% GDP growth in the second quarter (seasonally adjusted annual rate).
The most recent Purchasing Managers’ Indices point to a slowdown in China’s domestic economy, though the figures are likely distorted to some degree by bad weather, including high temperatures, typhoons, and flooding. These effects should reverse in the coming months. As a result, we expect any efforts from the government to boost growth will be incremental.
Equity market dynamics
The primary beneficiary of the AI capex boom has been emerging market technology hardware and semiconductor stocks, particularly in Korea.
At their peak this year, an index of these stocks had advanced nearly 120% from January (for Korea it was over 250%). Even after the large correction from late June, the stocks are still up nearly 80% in aggregate (all returns as at 6 August 2026). US hardware stocks have dropped 6% in sympathy but are also still showing good year-to-date gains (see Exhibit 1).
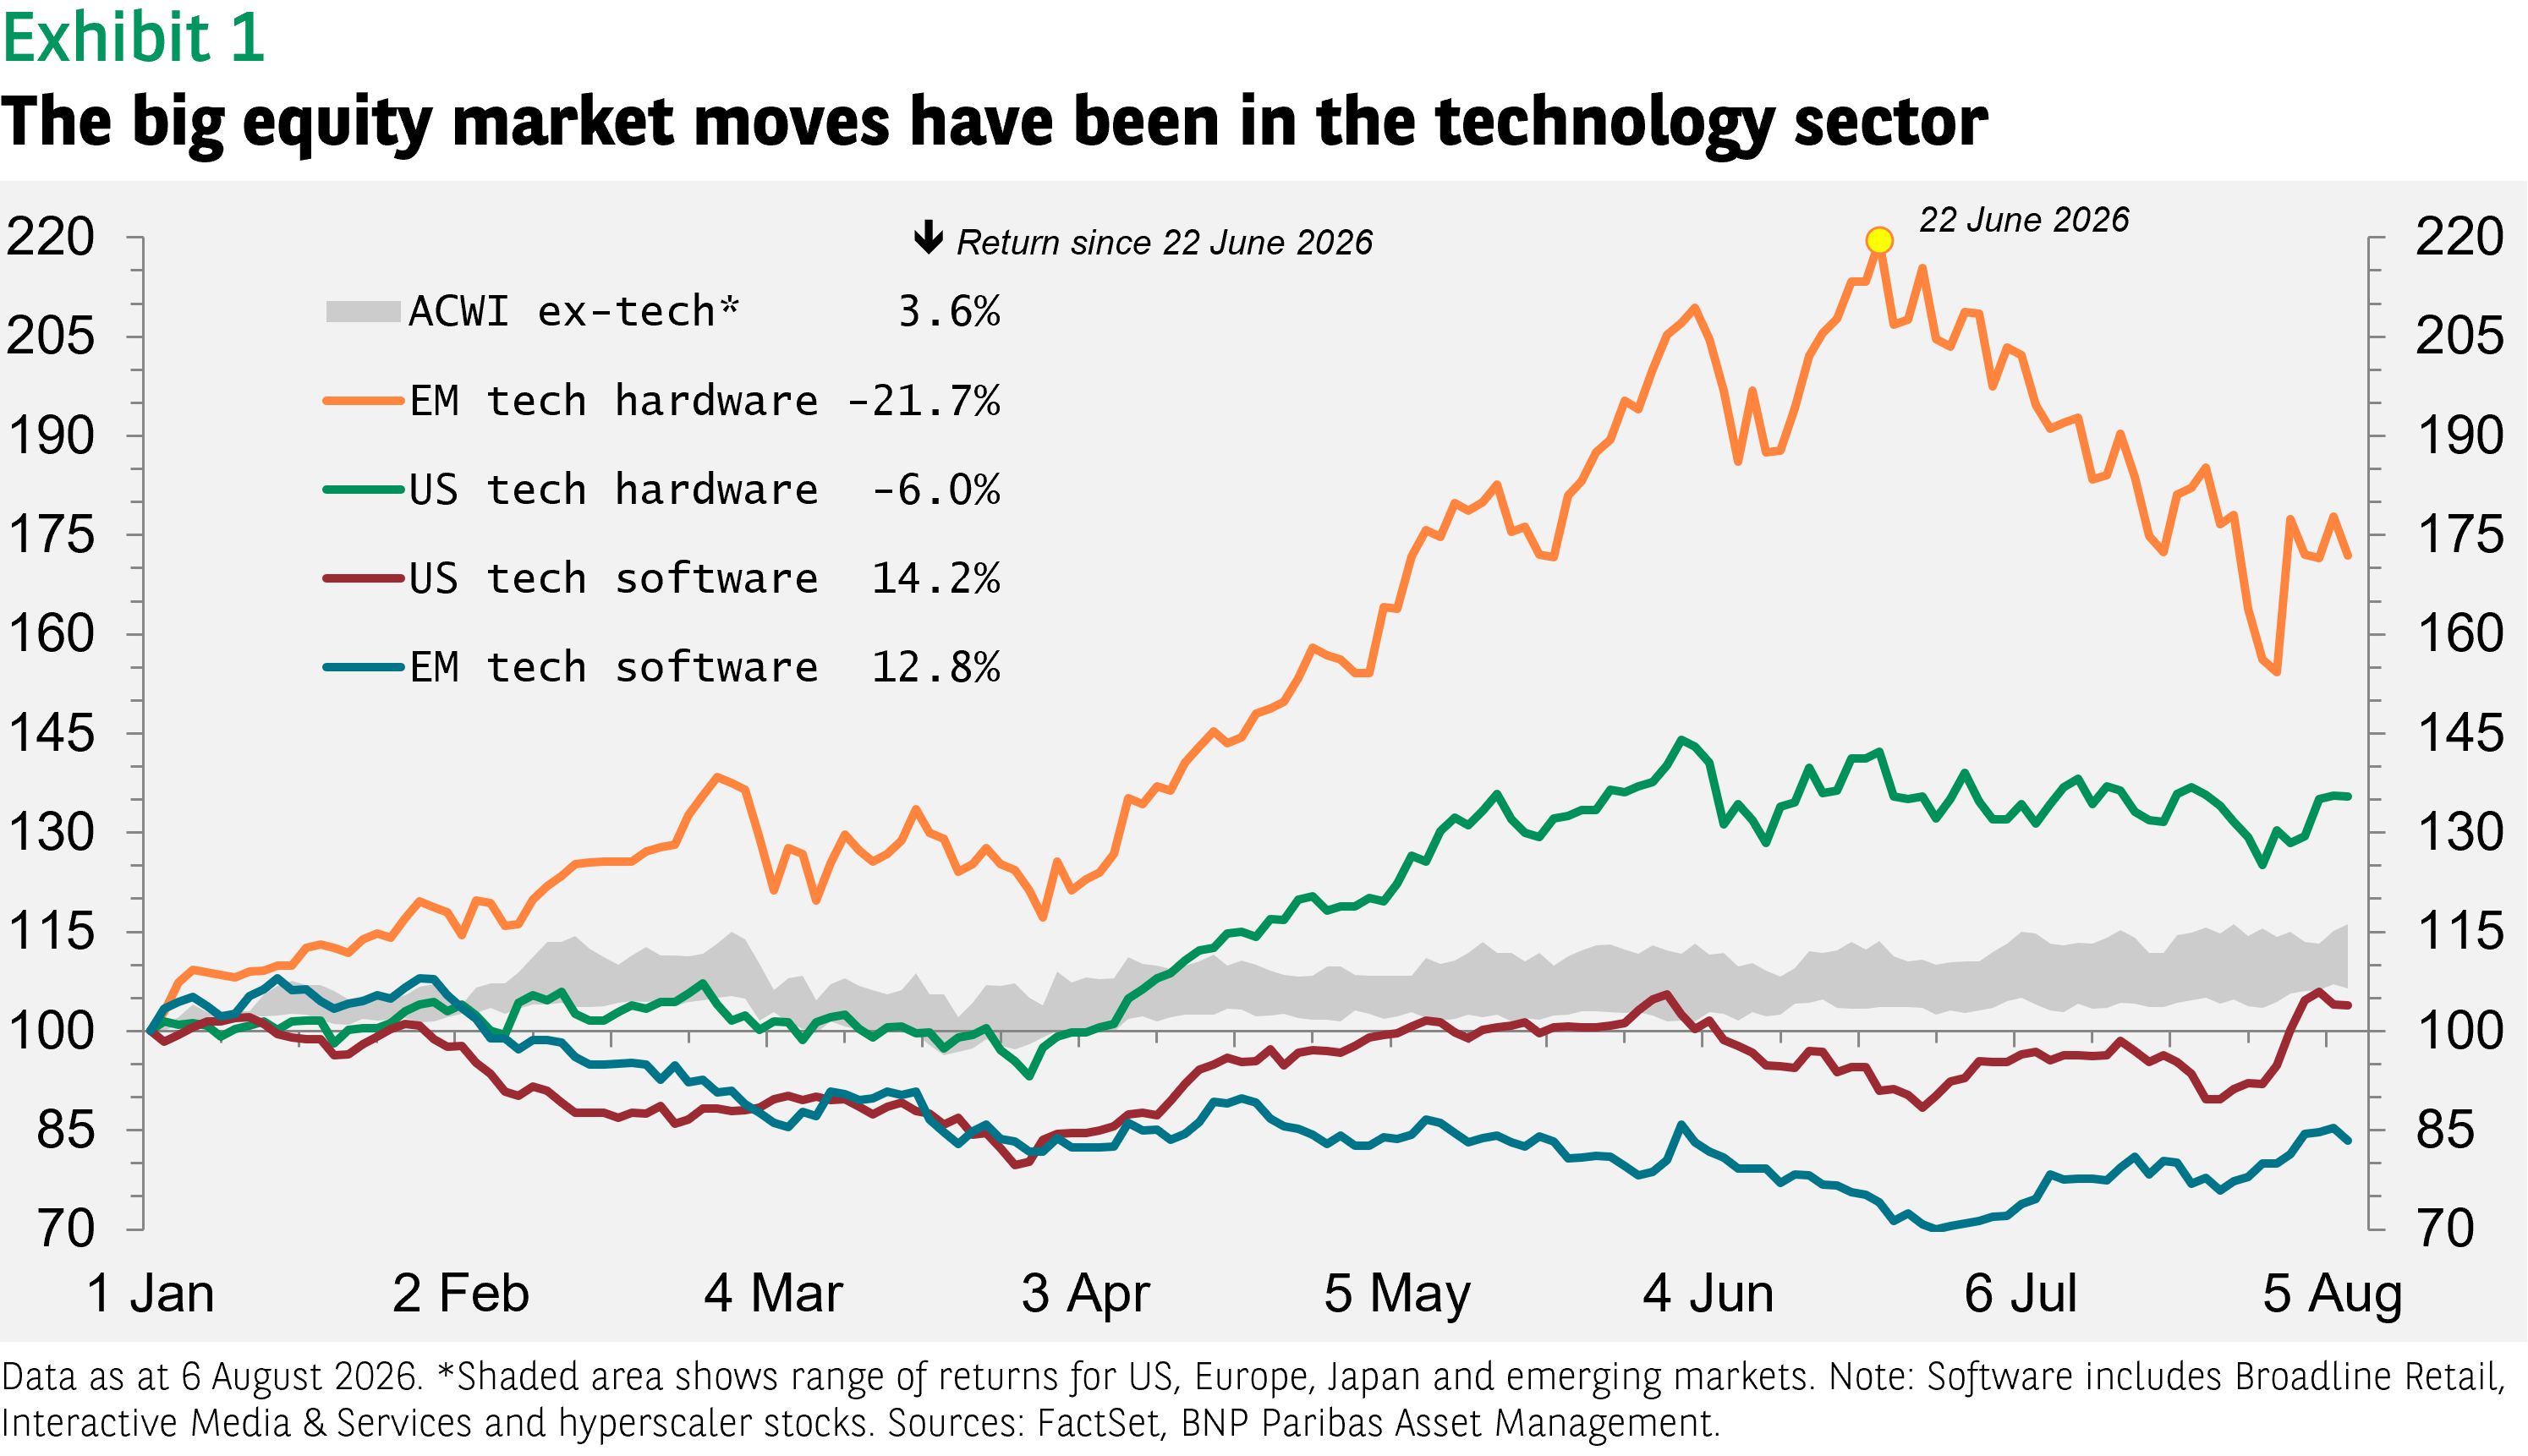
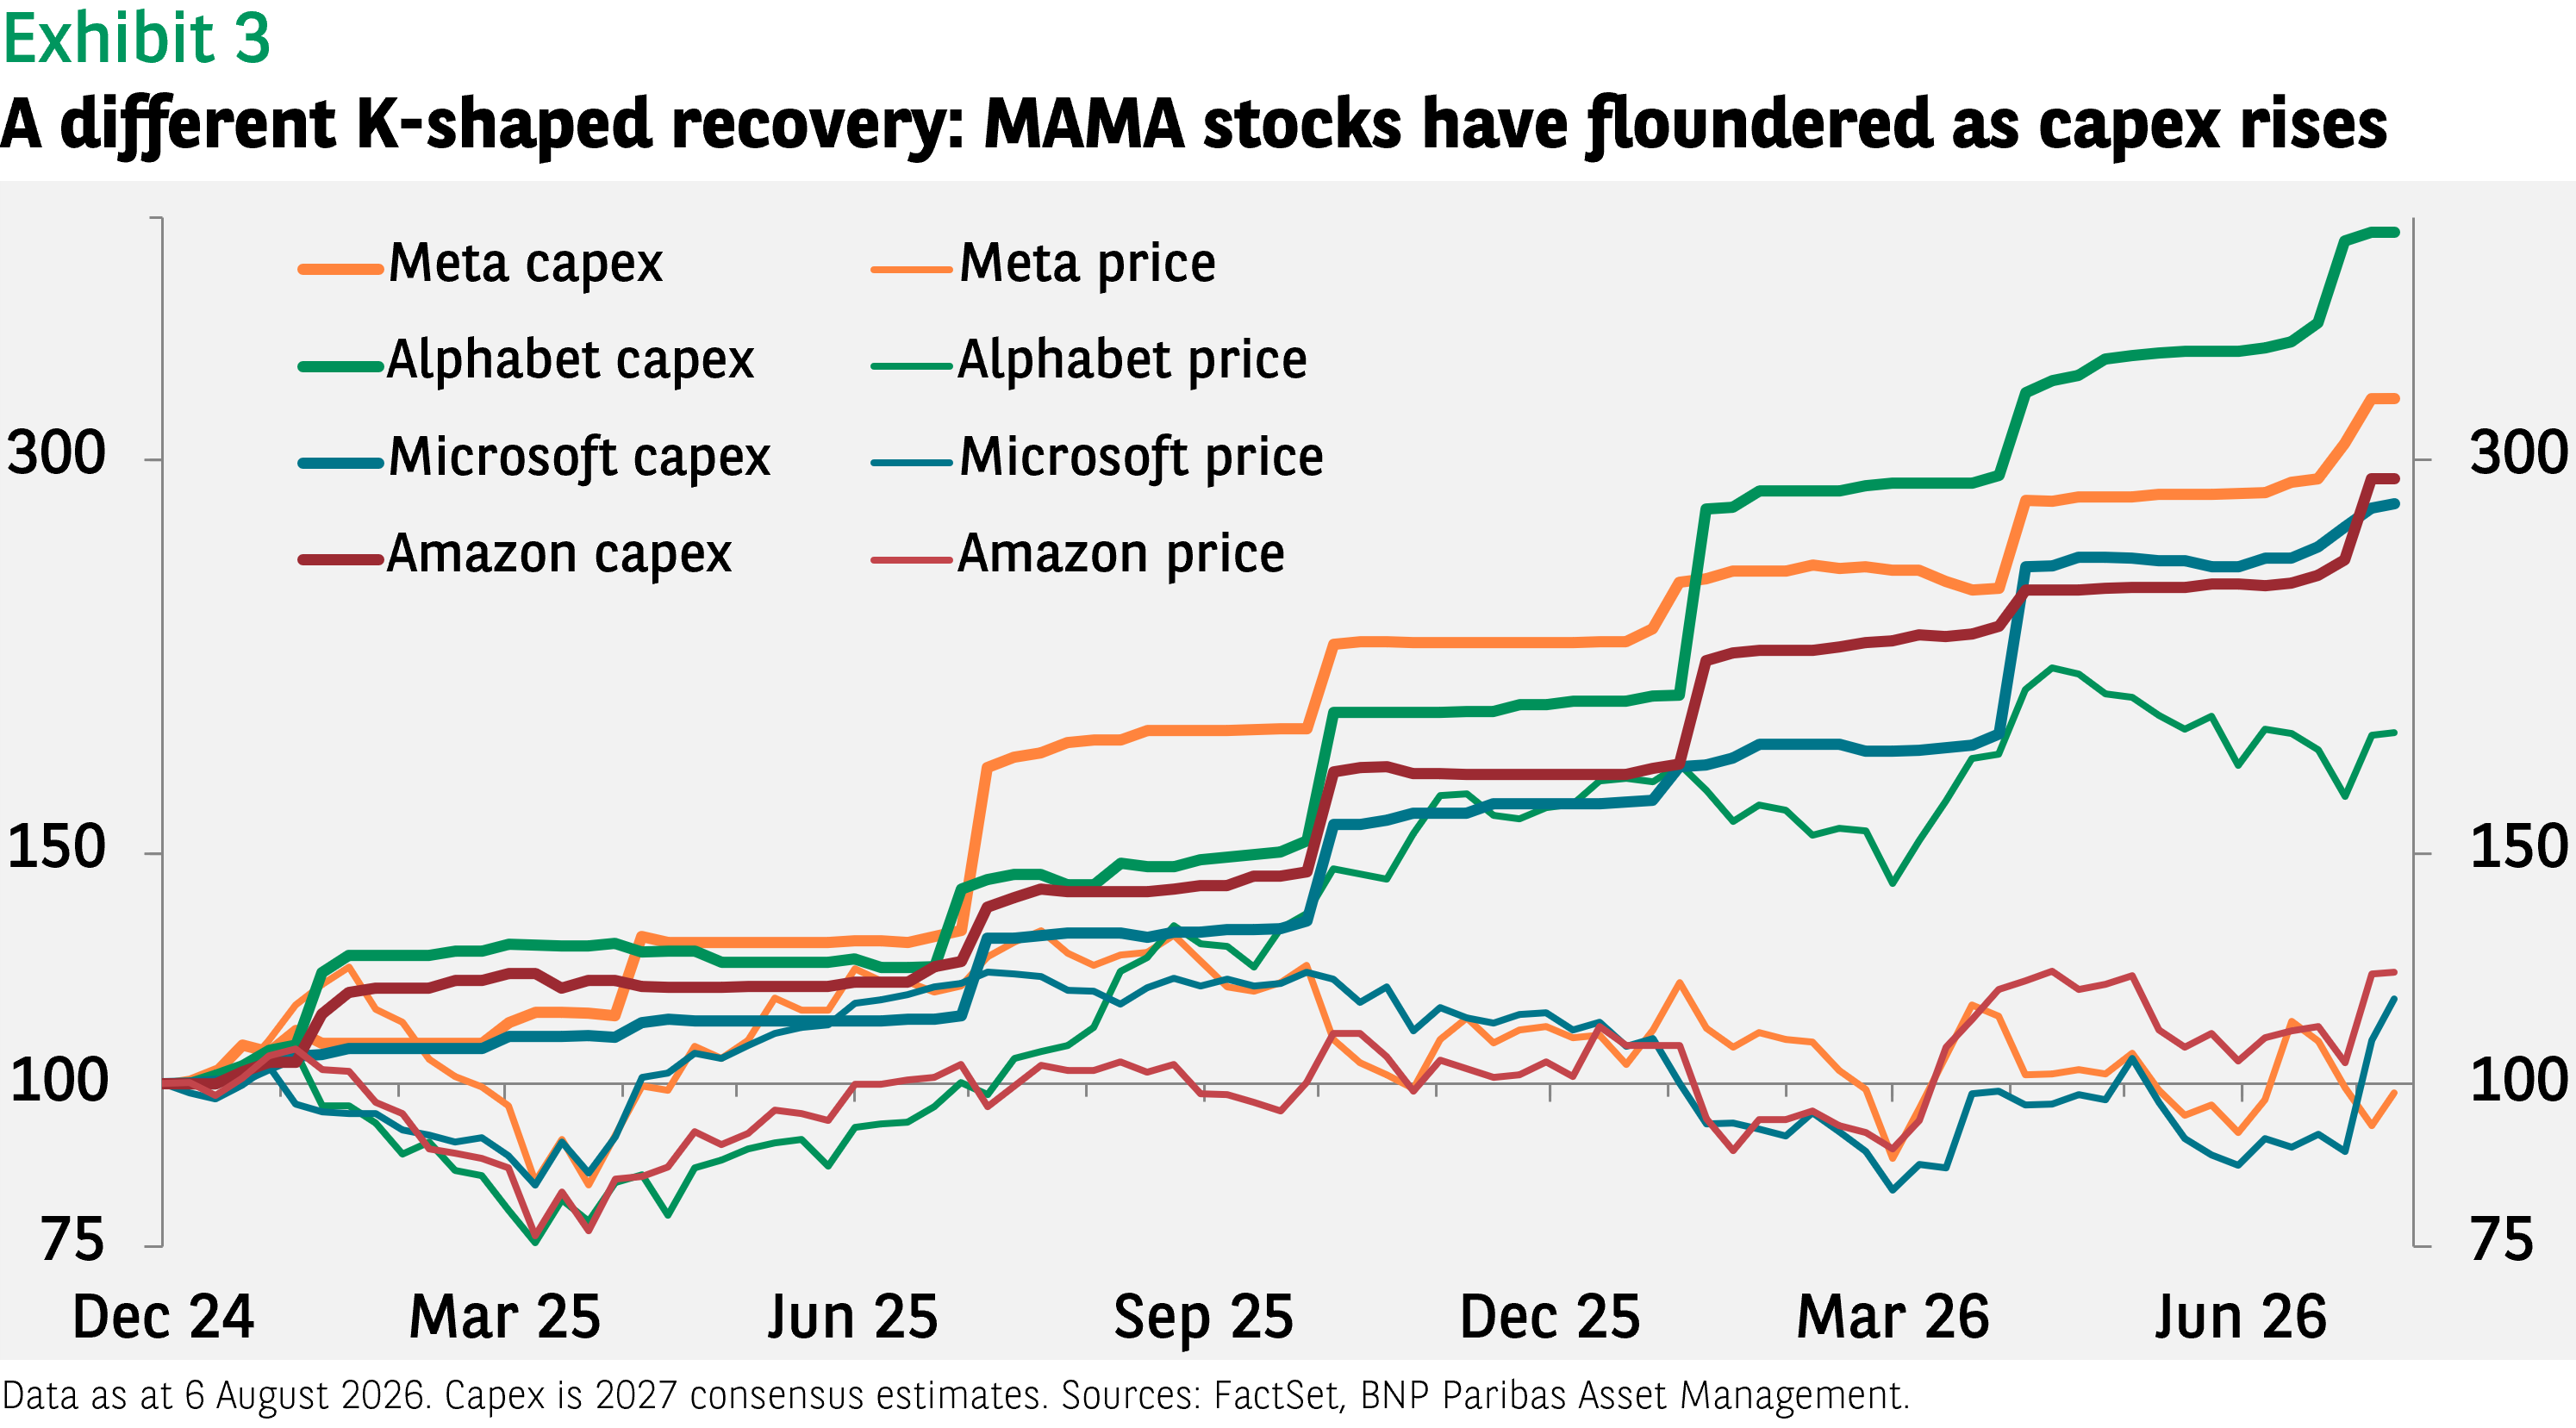
At times, the mirror image of the hardware sector has been the software sector, whose business models have come under threat from AI, and hyperscalers (or MAMA stocks: Meta, Alphabet, Microsoft and Amazon) whose capex dampens their near-term earnings prospects. More recently, investors have focused on the revenue generated by AI models and these stocks have bounced back.
There has been comparatively little contagion from the hardware sell-off to other, non-tech markets. The renewed conflict in the Middle East, swings in oil prices and bond yields (exacerbated by a dovish, and uncommunicative US Federal Reserve) have restrained gains, but most markets have continued to advance modestly. The non-tech part of the MSCI All Country World Index is up 10% year to date, a quite reasonable return viewed in isolation.
What goes up must come down?
The dramatic drop in emerging market tech stocks has understandably raised questions about whether the AI bubble is bursting. We are of the view that the sell-off was more technical than fundamentally-driven. Given the large increase both in stock prices and in earnings for the sector, above-average volatility was to be expected.
Foreign investors have been selling Korean equities since February, according to data from the Korean Stock Exchange, likely prompted by a desire to rebalance portfolios and take profits. The redemptions accelerated in May and June, contributing to the depreciation of the won over the period.
Individual Korean investors, however, have been willing buyers of the shares foreigners were selling. US-domiciled ETFs, meanwhile, have had inflows all year (except for May) and July’s inflows were the highest year to date.
One factor that has been suspected of contributing to the depth of the market’s decline has been the popularity of leveraged ETFs.
Providing the opportunity to investors to double their gains (or losses) in a market that had already more than tripled in value can understandably be seen as a sign of excessive (if not necessarily irrational) exuberance.
While the funds have proved popular, with assets under management reaching $33 billion at their peak, it is not obvious that they were behind the swing in investor sentiment.
During the big run-up in the stocks, which began at the end of March, flows were negative. The inflows have primarily come during market sell-offs, like the one in March after the start of the Iran war and the sell-off that begain in late June (see Exhibit 2).
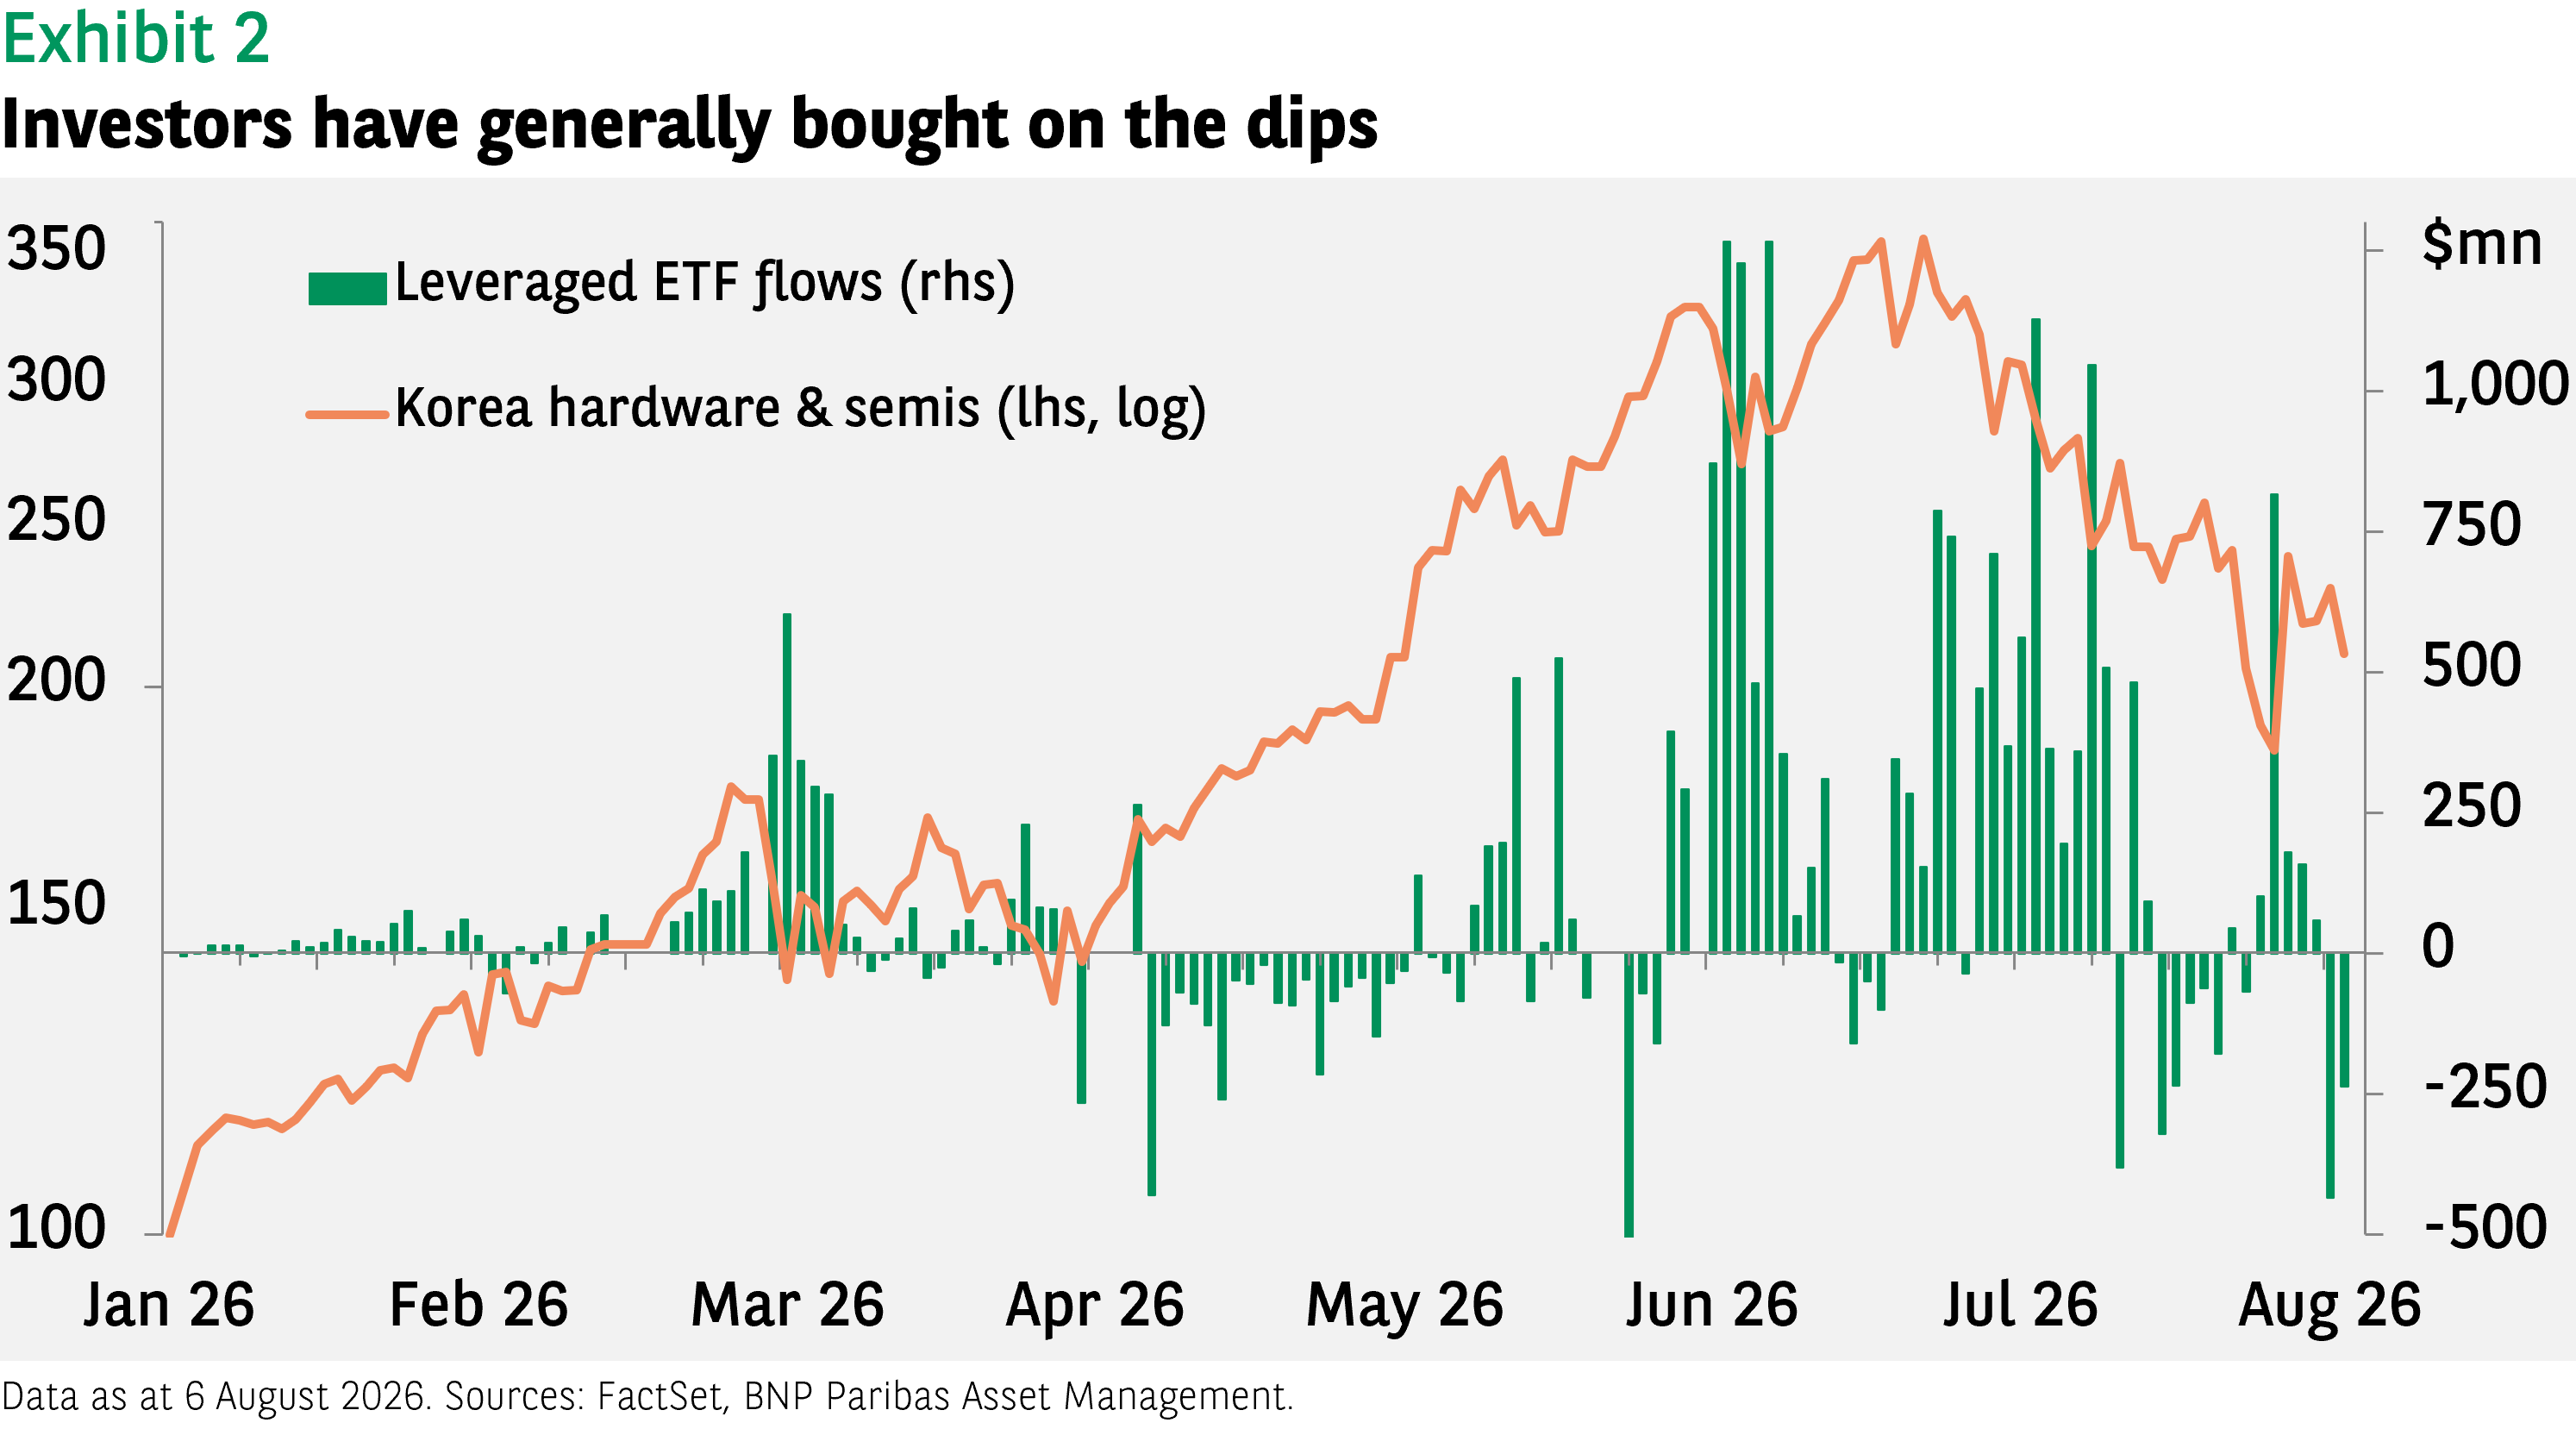
That said, they may have contributed to the market volatility and intensity of the sell-off. The recent rebound may have been supported by the hedge fund Citadel taking over the assets of another hedge fund, Situational Awareness, which ran into difficulties.
The primary risk to the market would be any indication that AI capex was fading. In fact, the opposite seems to be the case. The recent decline in some MAMA stock prices after they announced earnings results was partly due to plans to increase capex even further (see Exhibit 3). Not coincidentally, 2026 earnings-per-share estimates for the largest Korean hardware and semiconductor stocks have been going up.
Another potential catalyst for the sell-off is valuations, though high valuations by themselves rarely provoke a market correction in the absence of another factor.
At late-June’s market peak, the MSCI Korea Technology Hardware & Equipment index’s forward price-earnings ratio was just 7.2 times compared to a long-run average of 12.5 times — that is, P/Es were below average even then and are lower now.
Similarly, the semiconductor index P/E was 6.8 times in June compared to 8.9 times on average over the last 28 years. Given the growth prospects for the sector, that does not seem ‘excessive’, let alone irrational.
The world beyond tech
The outlook for the non-tech parts of the US market is positive. The Iran war has boosted energy stocks, while strong bank earnings have been reflected in share prices. AI spending is spilling over to companies in the materials and industrial sectors, and to small-cap stocks more broadly (also helped by tariffs and less competition from imports).
Though worries about the consumer persist, retail sales are steady. Consumption has been partly funded by households dipping into savings, but with the unemployment rate low and expectations that oil prices will fall again, this is a rational strategy.
The labour market may be more robust than perceived if one recognises that individuals setting up sole proprietorships are not captured in the non-farm payrolls data. During the ‘job drought’ of 2025, when employment outside of the healthcare sector declined, there was a more-than-compensating increase in sole proprietorships as people set up shop on their own.
The widening availability of AI tools is likely accelerating the trend. New business applications through the end of June are 17% higher than at the same time last year.
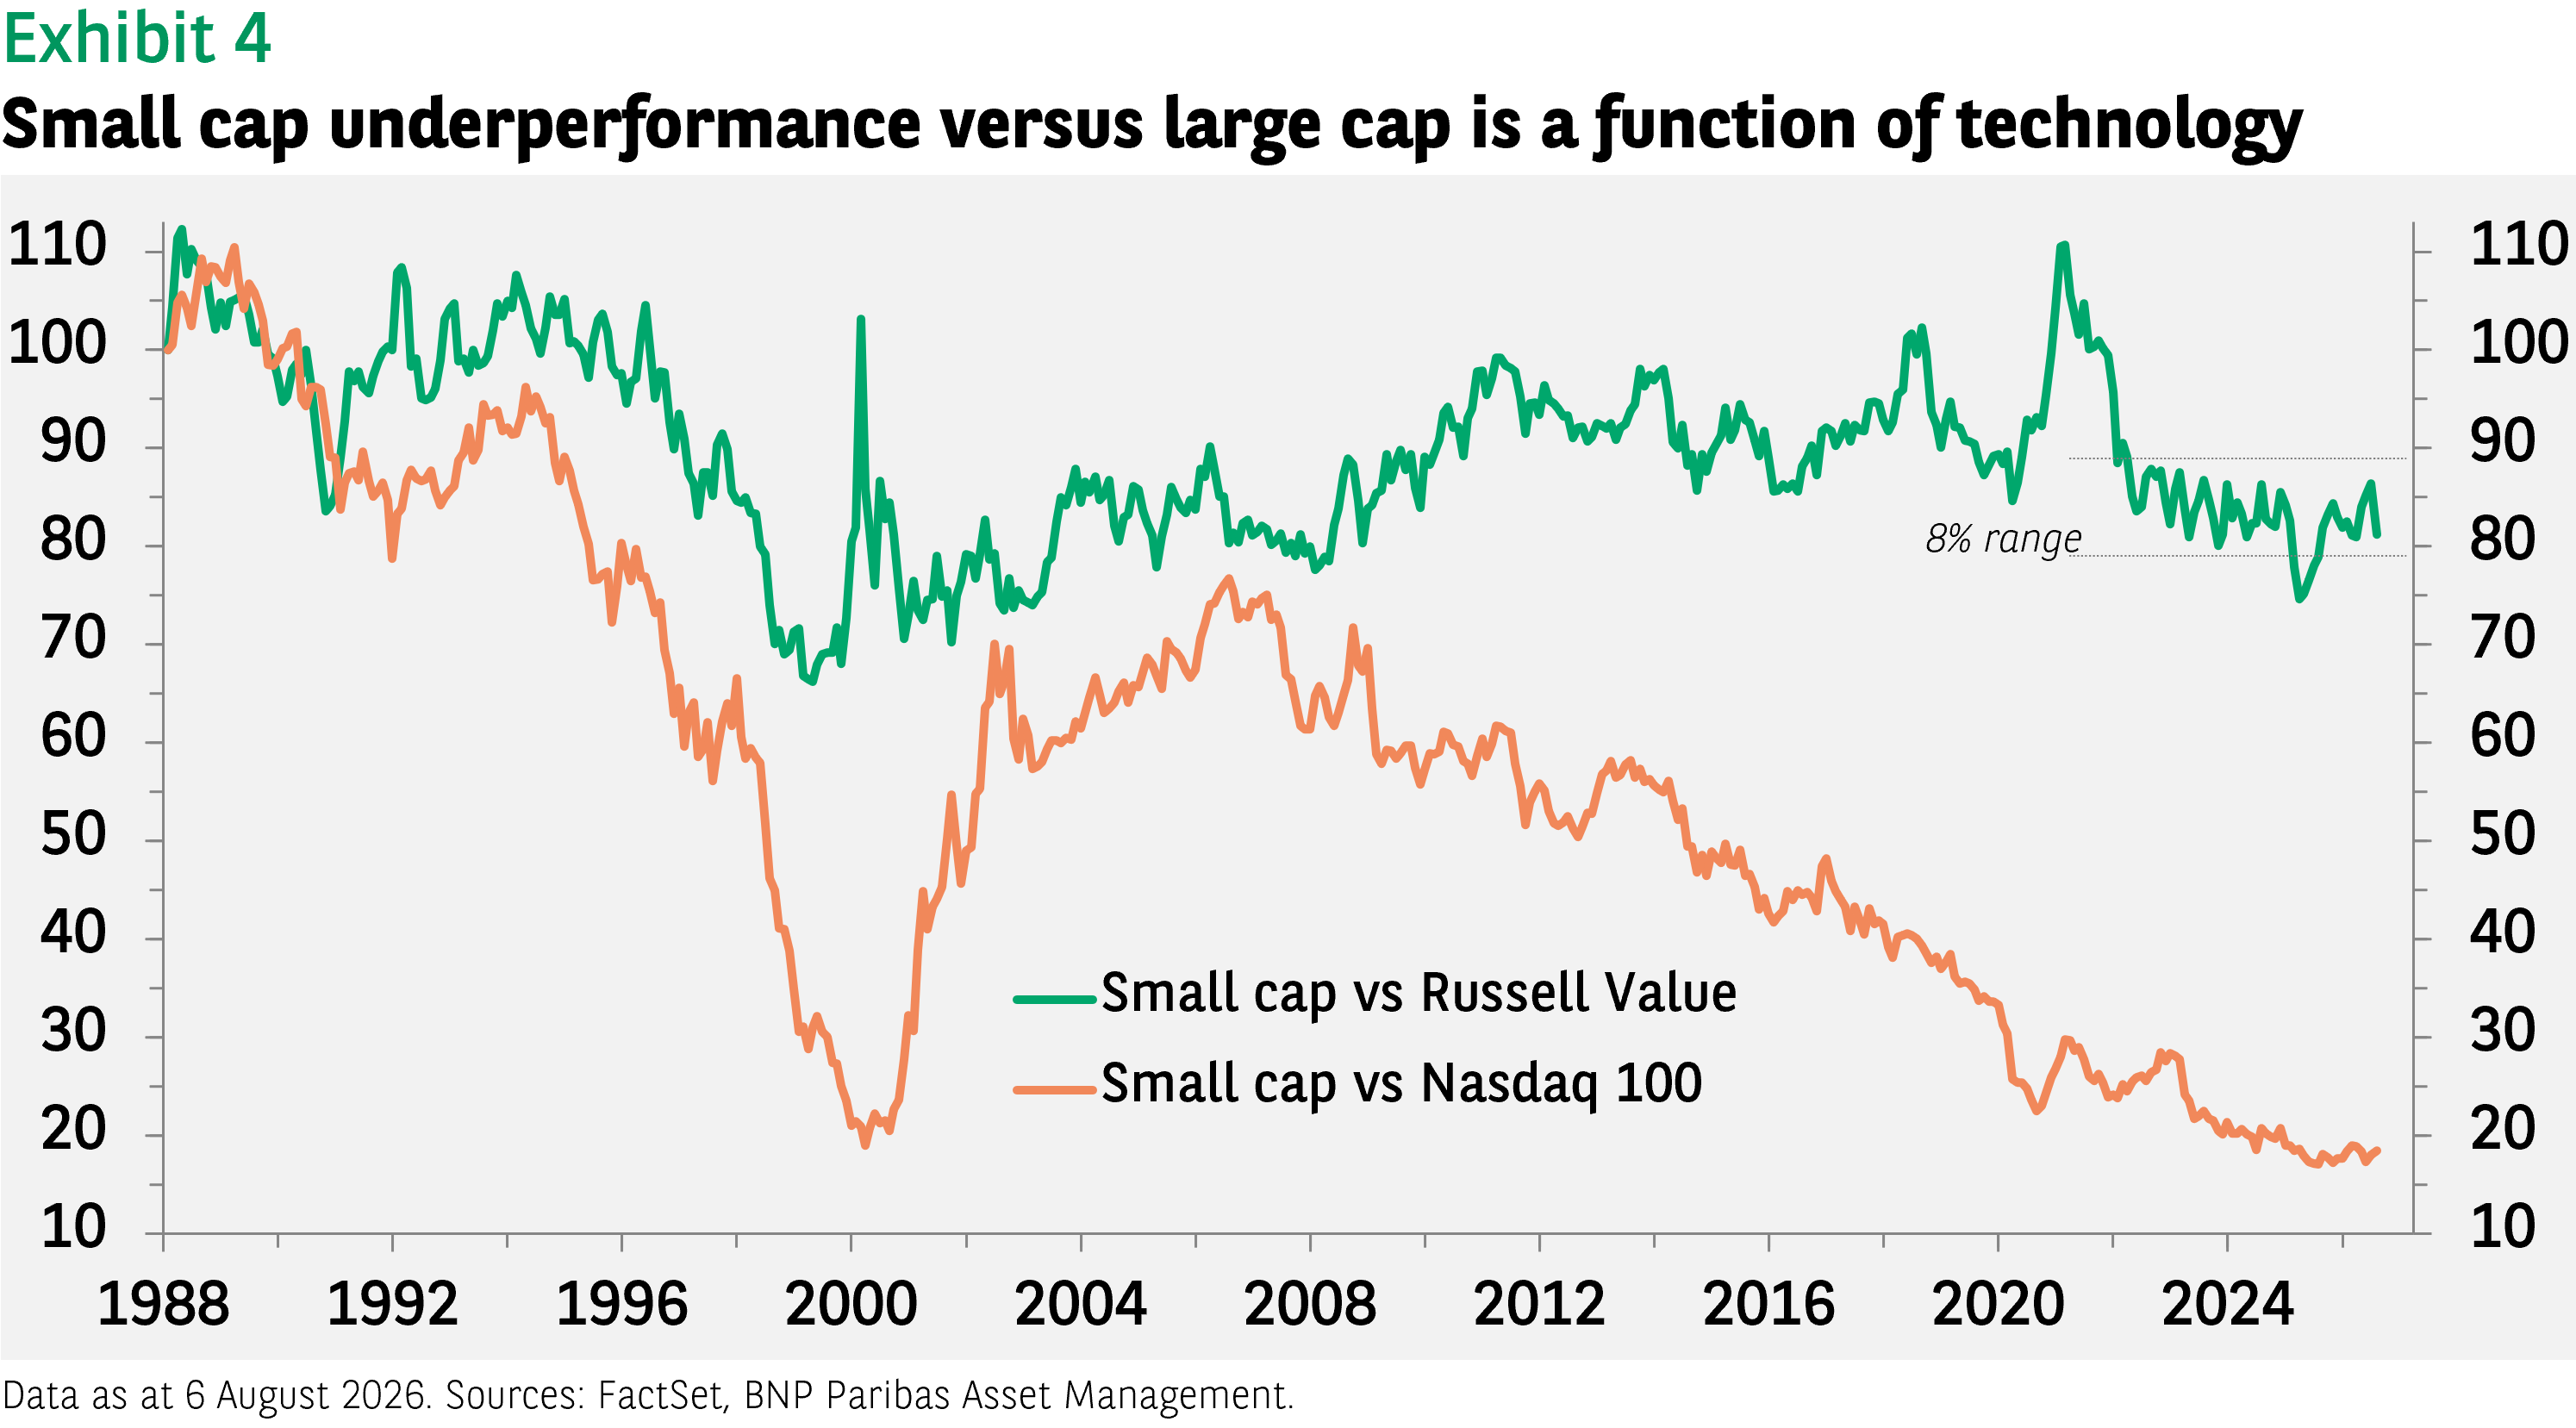
Given this backdrop, we would not foresee either significant under- or out-performance of small-cap stocks versus (non-tech) large-cap stocks; both markets should do well.
The historical underperformance of small-cap stocks has been a function of the outperformance of tech stocks rather than variation in small-cap stock performance. Relative to non-tech US stocks, small caps have largely performed in line, oscillating within a fairly narrow range over several years (see Exhibit 4).
Europe’s potential
For much of Q2 the primary driver of European equity relative performance has been the swing in oil prices linked to developments in the Middle East. Since mid-May, Brent oil has dropped 26% and European equities have modestly outperformed global equities.
As oil prices are still somewhat elevated, there is potential for European markets to make up more lost ground if a longer-lasting resolution is found to the conflict, but more sustained outperformance of European equities looks unlikely.
This is at least partly due to comparatively poor earnings results. The latest earnings season was good, with profits for European companies rising by 23%, based on our analysis of Bloomberg data, similar to the US rate. But US surprises were twice as large.
Moreover, a large share of the gains in Europe came from the energy and financials sector, which is likely unsustainable, while US profit growth also came from tech, which should be more persistent. Estimates for 2027 see European earnings growth dropping to half the US rate.
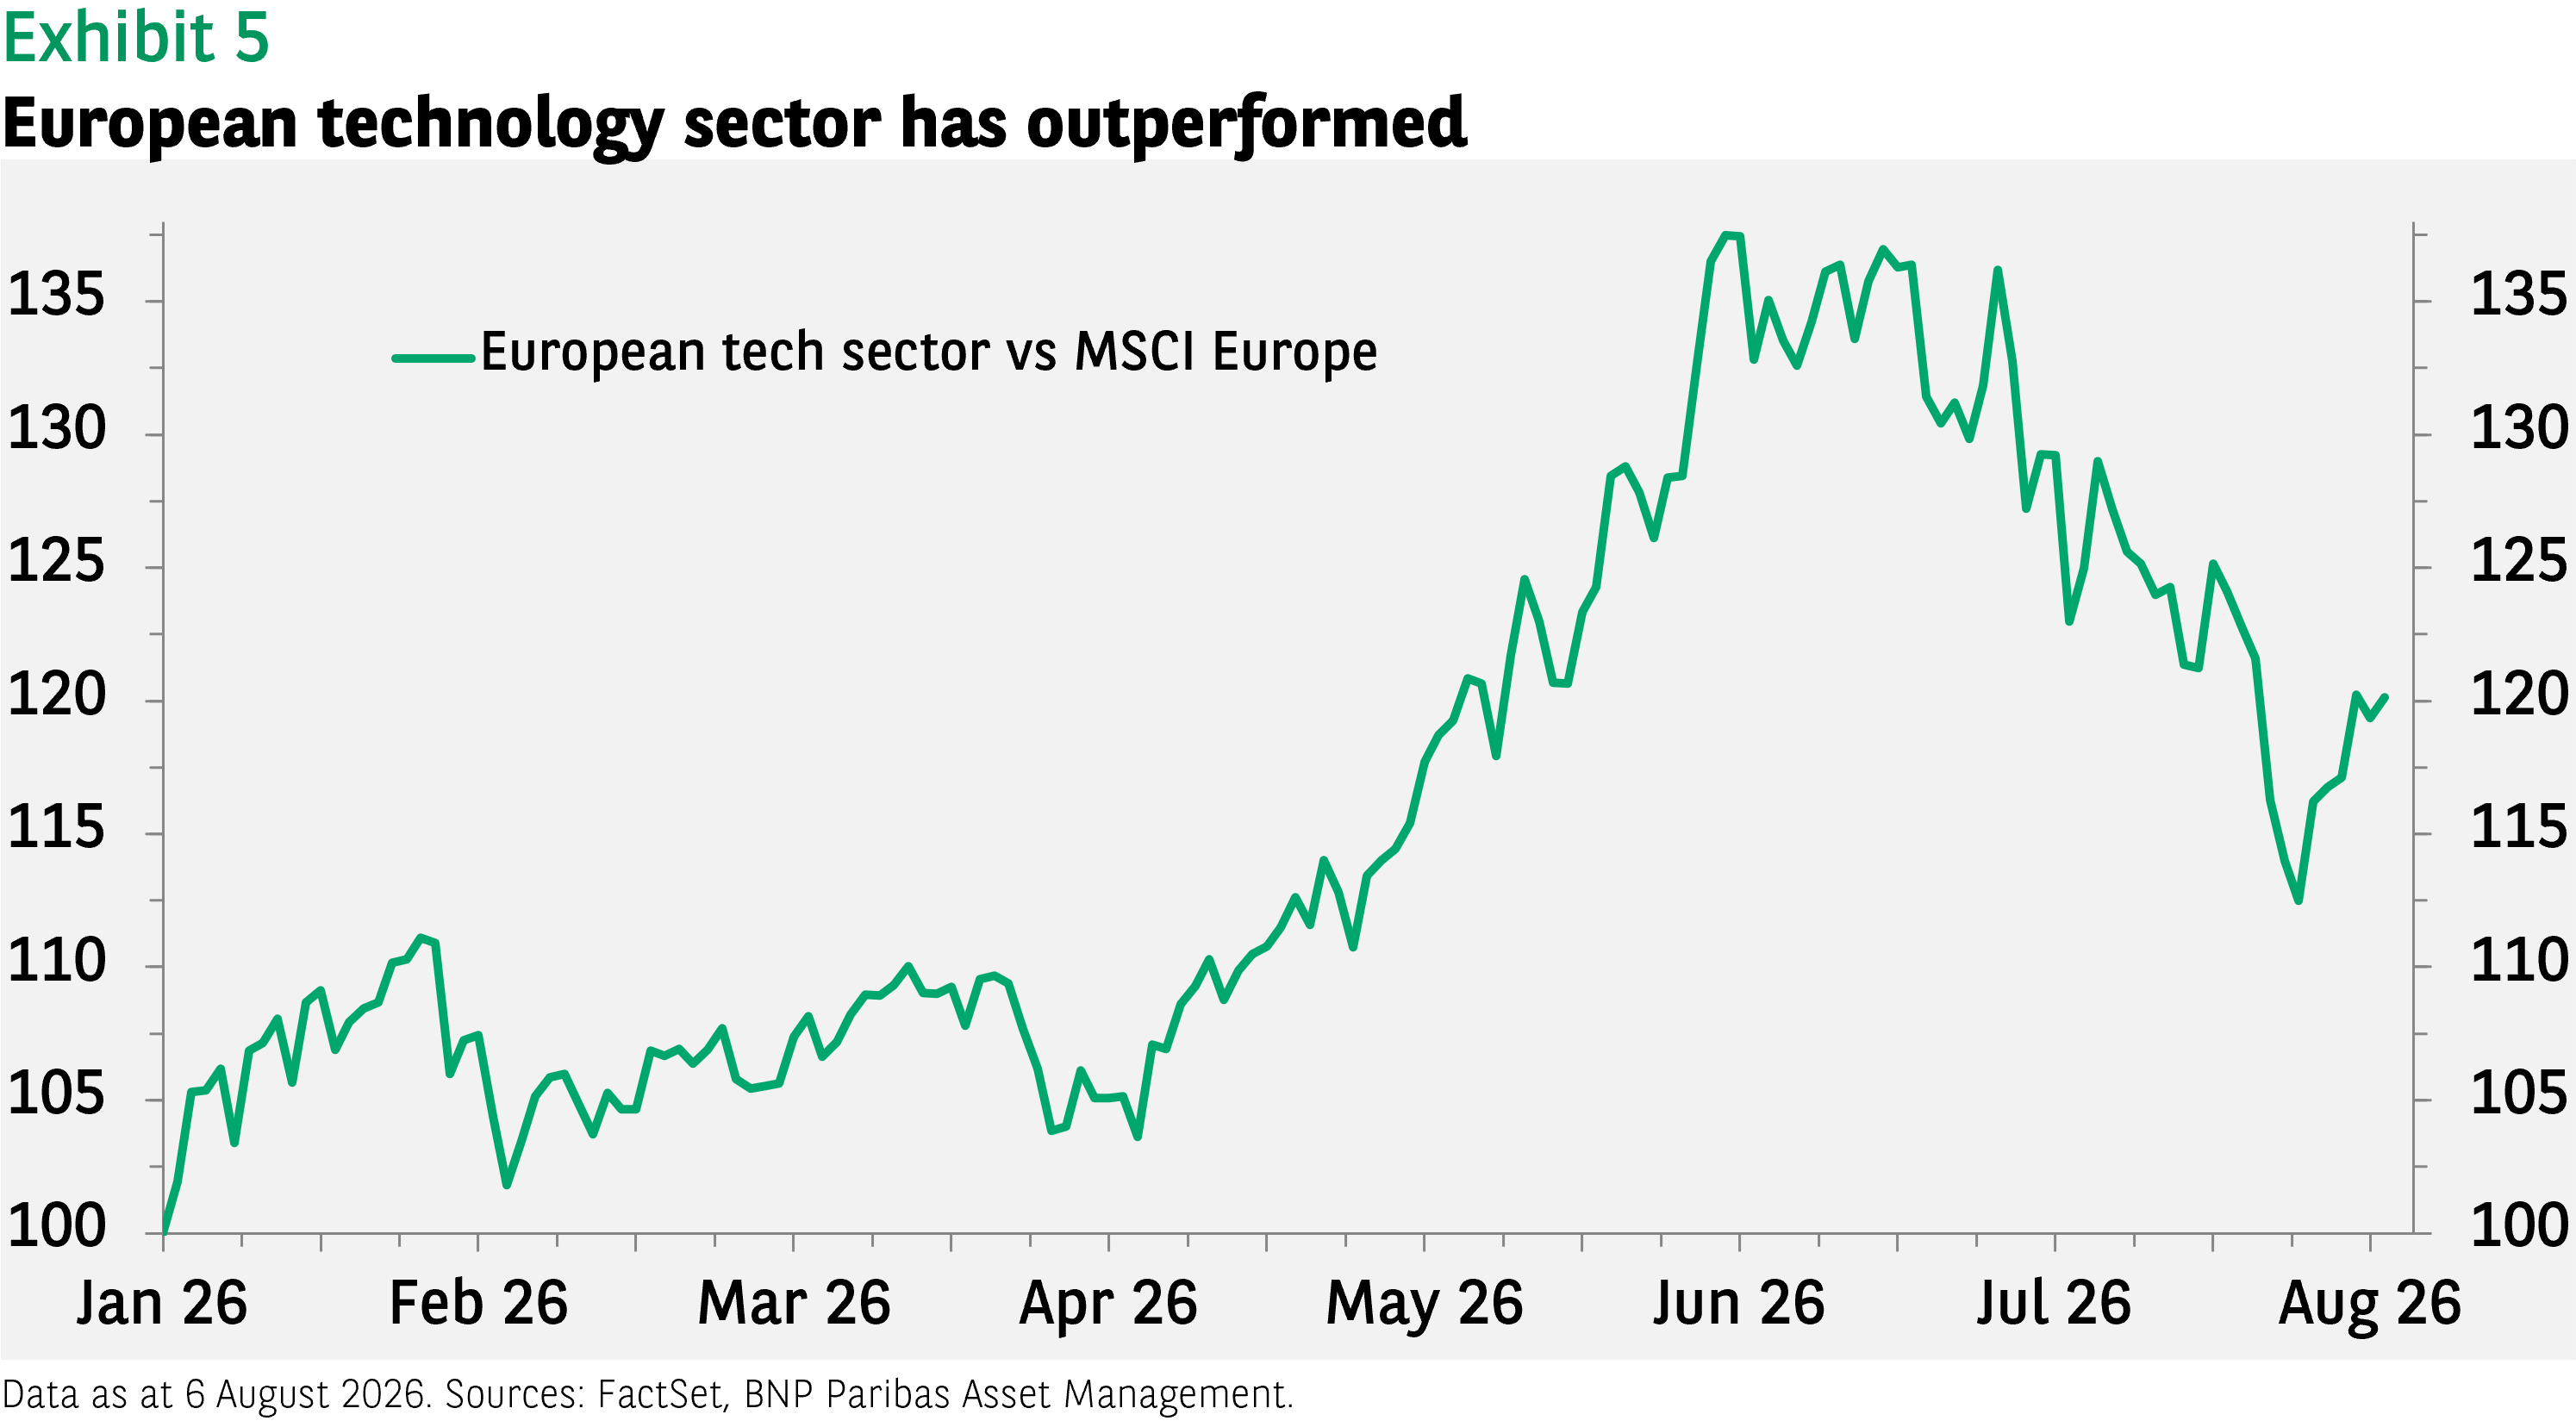
The opportunity, then, is likely to be greater in certain segments of European equities rather than in the broad index. For example, while the tech sector is not as large in Europe as in the US (9% of the MSCI index versus nearly 50% for the US), the sector has outperformed the rest of the market (see Exhibit 5).
The recent global sell-off in tech hardware and semiconductors did not leave the market unscathed, but we anticipate renewed superior performance in the quarters ahead.
Monetary policy will be a key factor in the future relative performance of European equities versus the US. The European Central Bank’s 25-basis-point increase in policy rates, while the Fed has stayed on hold, has not helped Europe’s equity performance.
Markets are pricing in an 86% probability of another 25bp hike at the bank’s next meeting in September even as growth remains near trend, while the odds of a single hike by the Fed are 60%. Regardless of what happens with policy rates, 10-year market yields continue to be driven by oil.
The initial 50% jump in oil prices since July corresponded with a 20-30bp increase in US and German bond yields, respectively. Oil prices have dropped back 20% since, but yields are still near two-year highs.
Japan: The currency conundrum
The macroeconomic backdrop for Japan is supportive, with expansionary PMIs, rising scores for the Tankan Current Conditions index and positive expectations. The 160bp increase in 10-year government bond yields over the last 16 months has not had the same impact on equity markets as the (admittedly much larger) increase in US Treasury yields did on US equities in 2022.
Earnings growth in Q2 was exceptionally strong (55% year-on-year), though the full-year rate is expected to be a more reasonable 15%. Government fiscal stimulus should help drive earnings growth above and beyond existing AI capex.
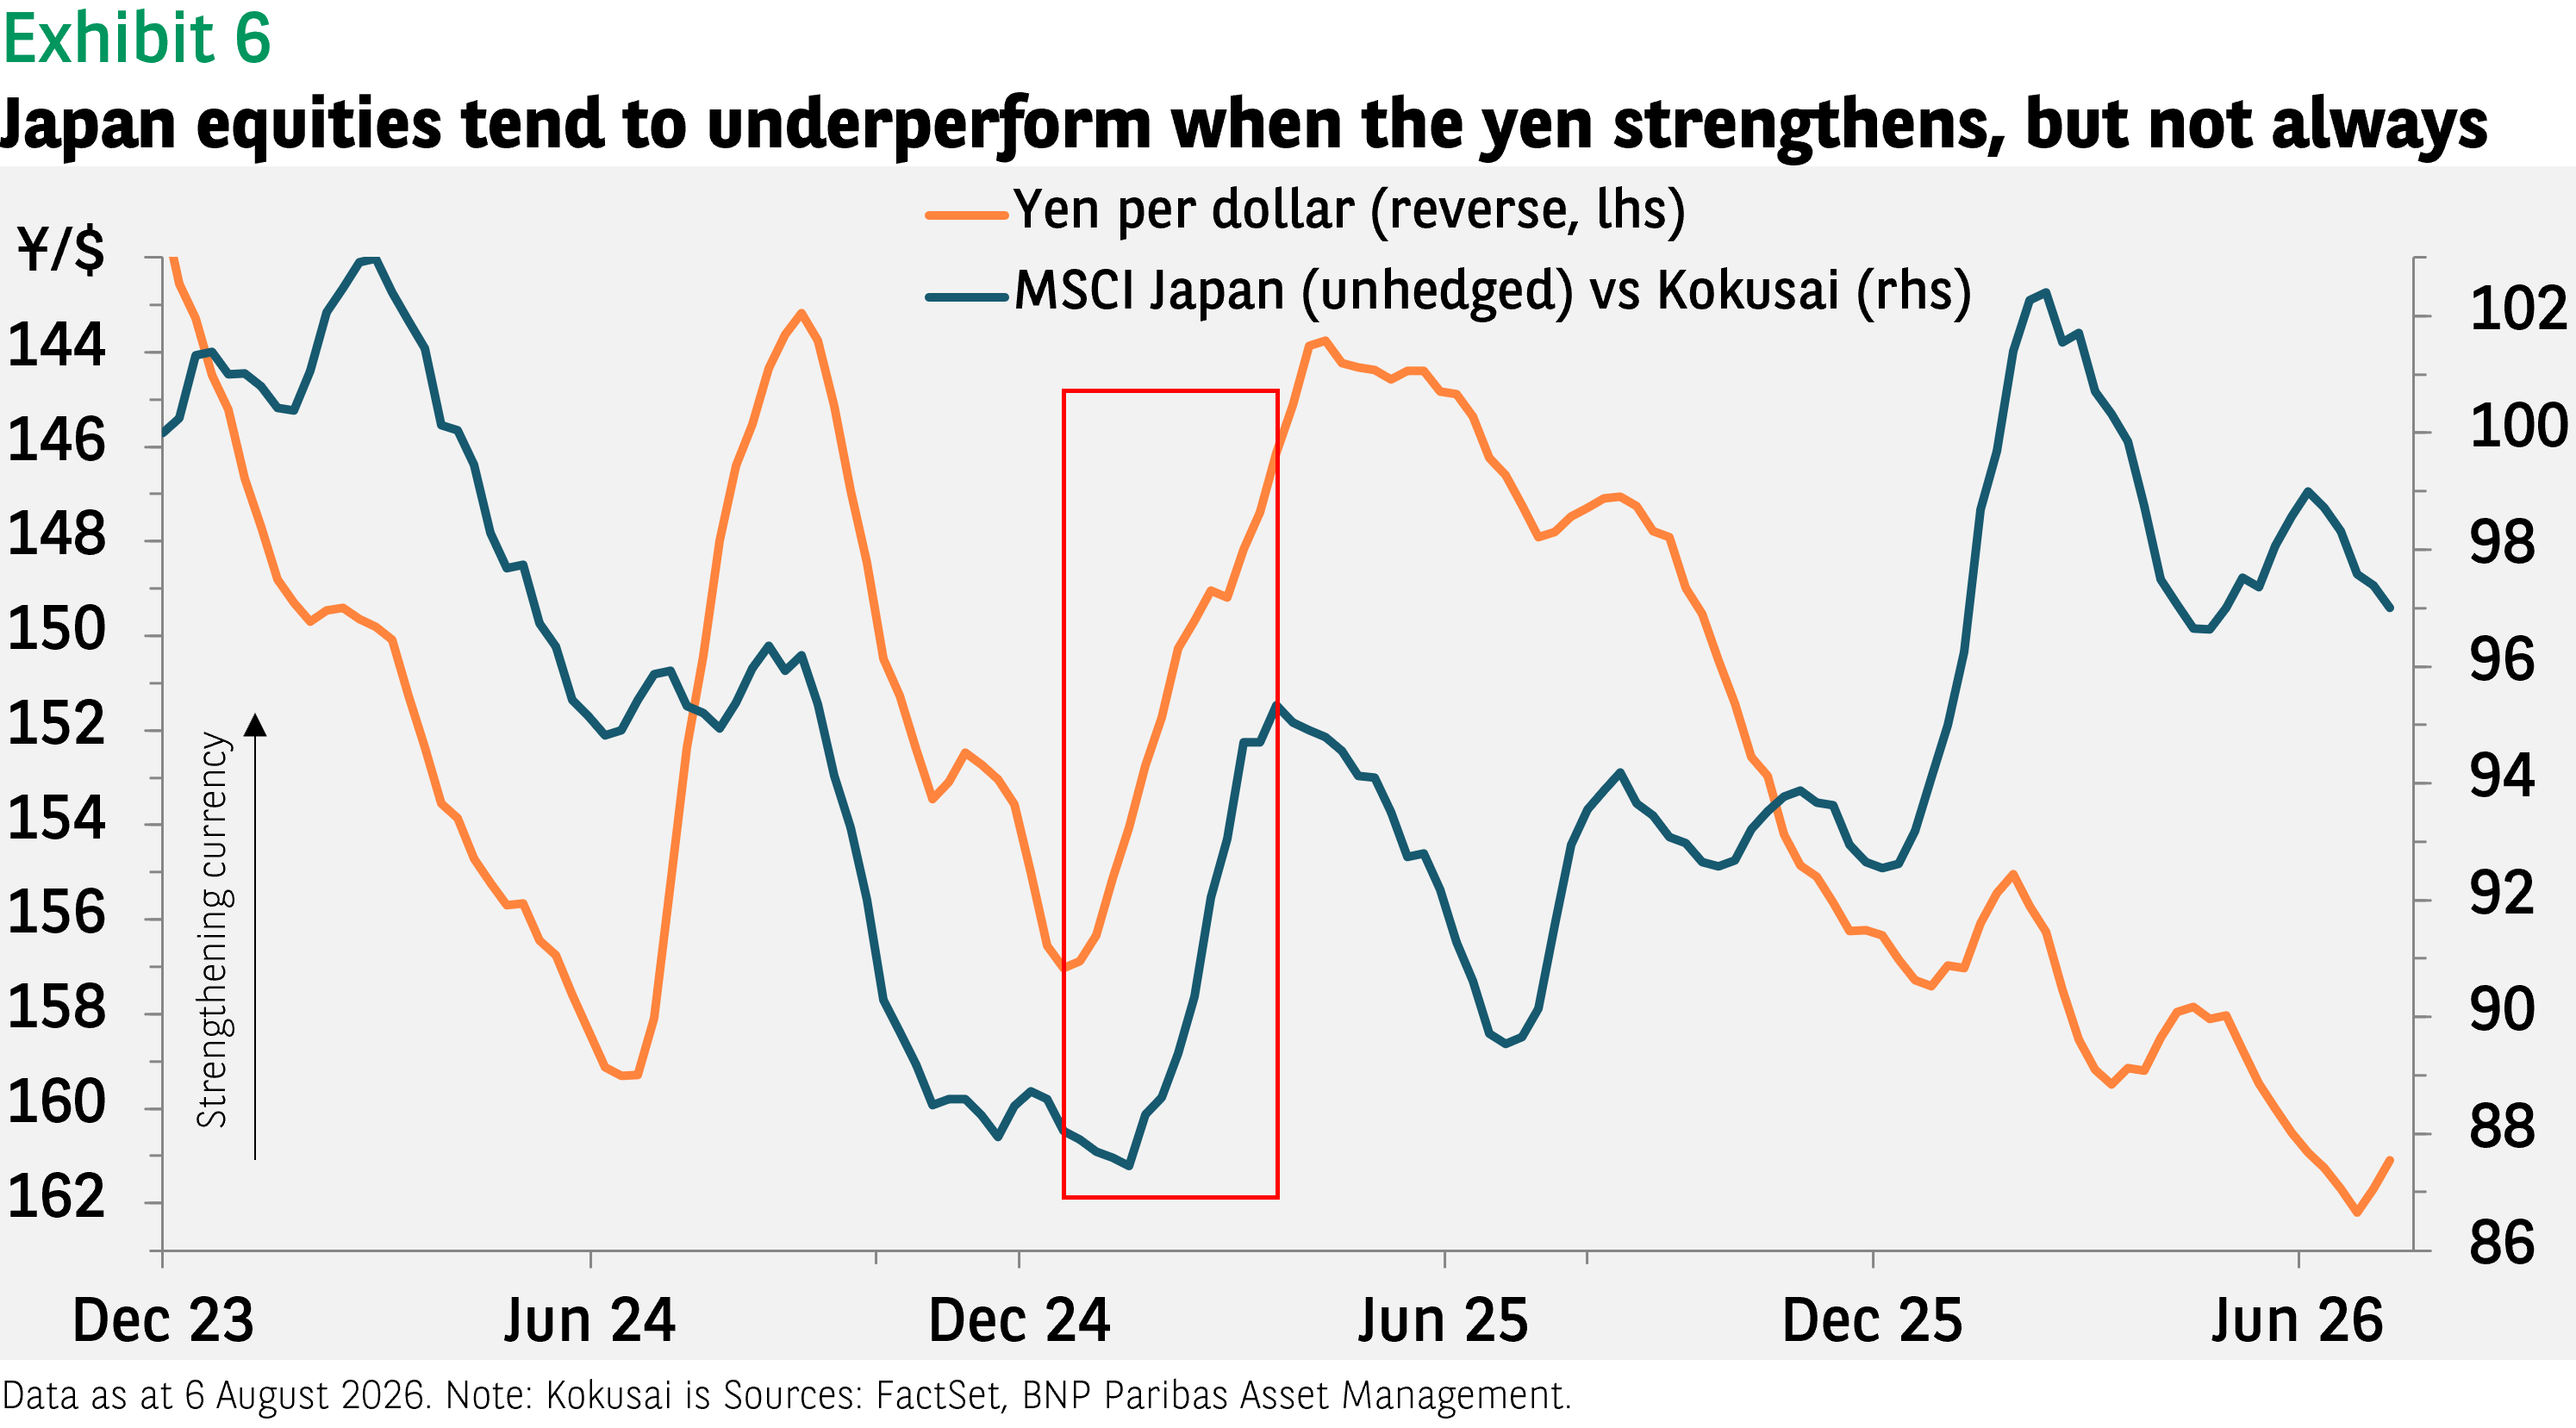
The biggest threat to the market is the potential strengthening of the yen as the Bank of Japan and US Treasury attempt to reverse some of the depreciation of the last two years. Roughly 60% of the revenue for companies in the MSCI Japan index come from sales abroad. This compares to about 40% for the S&P 500 and 36% for Germany, based on FactSet data.
Hence, Japan is seen as a market that benefits disproportionately from a weakening currency. The correlation is not perfect, however. There have been periods when Japanese equities have outperformed in yen terms even as the currency rose (see Exhibit 6). Nonetheless, if the governments succeed in pushing the currency up, the effect may offset otherwise positive fundamentals.
Data sources: Bloomberg, FactSet, BNP Paribas Asset Management as of 6 August 2026 (unless otherwise stated). Past performance should not be seen as a guide to future returns.


Disclaimer
This document is for informational purposes only and does not constitute investment research or financial analysis relating to transactions in financial instruments as per MIF Directive (2014/65/EU), nor does it constitute on the part of BNP PARIBAS ASSET MANAGEMENT Europe or its affiliated companies an offer to buy or sell any investments, products or services, and should not be considered as solicitation or investment, legal or tax advice, a recommendation for an investment strategy or a personalized recommendation to buy or sell securities.
Due to its simplification, this document is partial and opinions, estimates and forecasts herein are subjective and subject to change without notice. There is no guarantee forecasts made will come to pass. Data, figures, declarations, analysis, predictions and other information in this document is provided based on our state of knowledge at the time of creation of this document. Whilst every care is taken, no representation or warranty (including liability towards third parties), express or implied, is made as to the accuracy, reliability or completeness of the information contained herein. Reliance upon information in this material is at the sole discretion of the recipient. This material does not contain sufficient information to support an investment decision.
Issued in the UK by AXA Investment Managers UK Limited, which is authorised and regulated by the Financial Conduct Authority in the UK. Registered in England and Wales, No: 01431068. Registered Office: 22 Bishopsgate, London, EC2N 4BQ.
AXA IM and BNPP AM are progressively merging and streamlining our legal entities to create a unified structure
AXA Investment Managers joined BNP Paribas Group in July 2025. Following the merger of AXA Investment Managers Paris and BNP PARIBAS ASSET MANAGEMENT Europe and their respective holding companies on December 31, 2025, the combined company now operates under the BNP PARIBAS ASSET MANAGEMENT Europe name.
AXA IM and BNPP AM are progressively merging and streamlining our legal entities to create a unified structure
AXA Investment Managers joined BNP Paribas Group in July 2025. Following the merger of AXA Investment Managers Paris and BNP PARIBAS ASSET MANAGEMENT Europe and their respective holding companies on December 31, 2025, the combined company now operates under the BNP PARIBAS ASSET MANAGEMENT Europe name.