AXA IM Life Cycle Solution: A Flexible and Efficient Retirement Optimisation Approach
KEY POINTS
The evolving landscape of pension markets
Pension systems are facing increasing pressure. In addition to the long-standing challenges in improving funding ratios since the global financial crisis, the combination of longevity, inflation, and a difficult economic climate has made the path to recovery more complex. Moreover, the regulatory changes in response to the major crisis have accelerated the shift from defined benefit (DB1) plans to defined contribution (DC2) plans, both occupational and personal, on a global scale. This shift has led to three major trends in the market:
- The responsibility for managing pension risk has shifted from institutions to individuals, driven by the global movement from DB to DC schemes.
- Governments have introduced tax incentives to promote early, long-term investments through DC plans, helping individuals benefit from economic growth and increase future retirement income.
- There has been a push for voluntary personal savings (the "third pillar") to reduce pressure on public and occupational pensions (first and second pillars), encouraging the accumulation of supplementary retirement income.
This shift is evident in recent pension reforms, such as the Netherlands' move towards a new pension system and France's Green Industry Law in 2023. Beyond Europe, many countries are reevaluating their pension systems to align with these global trends.
Looking ahead, regulations have established a minimum threshold for investments in unlisted assets and those supporting small and medium-sized enterprises (SMEs) within life-cycle glide path management strategies. Additionally, any sustainability preferences expressed by investors will be integrated into defining their investment objectives.
- In a Defined Benefit pension plan, the employer/sponsor promises a specified pension payment, lump-sum, or combination thereof on retirement that is predetermined by a formula based on the employee's earnings history, tenure of service and age, rather than depending on investment returns.
- A Defined Contribution sees the employer, employee, or both make contributions on a regular basis. Individual accounts are set up for participants and future benefits are based on the amounts credited to these accounts plus any investment earnings.
Target-date strategies – commonly used but weak design
Target-date strategies are increasingly used as default investment options in many workplace DC plans, as well as in certain individual retirement plans. These strategies aim to align with the decreasing risk tolerance of investors as the “Maturity date” approaches by gradually reducing exposure to higher-risk assets and reallocating to defensive assets along a predetermined de-risking path, often referred to as a ‘glide path’ (Figure 1). Depending on the context, these solutions can either focus on the accumulation phase leading up to retirement or address post-retirement objectives if the target date extends beyond retirement itself. This ‘autopilot’ solution effectively mitigates common behavioral biases among investors – such as procrastination and status-quo – leading to its quick adoption in the market.
However, the design of most target-date strategies is still weak and lacks normalisation in the market in the context of DB plans. Common solutions may seem straightforward and effective, but they involve a multitude of problems:
- What are the specific investment objectives?
- Who is the target investor, and how can we adapt the solution to meet their individual needs?
- In which regulatory environment does the solution operate, and how do we ensure compliance with all relevant regulations?
- Given all these constraints, what is the ideal long-term optimal asset allocation?
Common practice is to establish the appropriate risk profile at both start and end points, as well as the de-risking trajectory. Recent pension reforms have highlighted the importance of product design, with detailed and precise regulatory guidelines to reframe what a good glide path should look like. For instance, France’s Green Industry Law mandates a minimum exposure to unlisted assets such as private equity and assets financing small and medium enterprises.
An efficient glide-path optimiser should be flexible to consider a range of factors
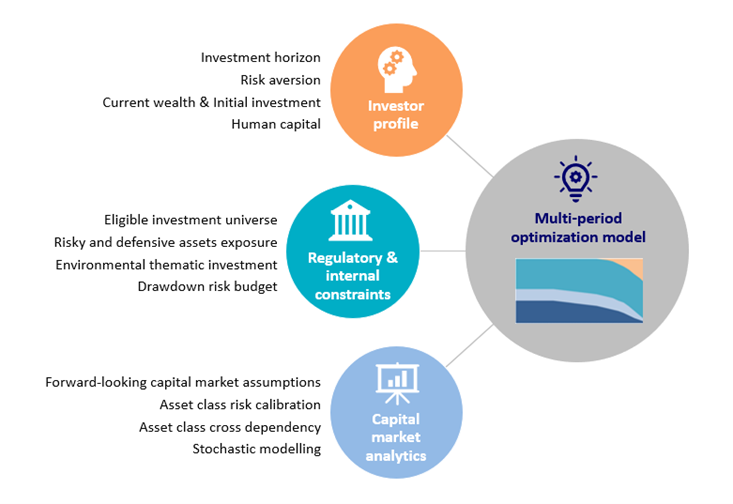
To address these diverse criteria, we have developed an internal multi-period optimization model. The model is flexible enough to incorporate complex regulatory and internal investment constraints, alongside investor-profiling elements such as investment horizon, risk aversion, current financial capital, and human capital (the present value of expected future income). Based on these profiling elements, we can quantify an investor’s risk tolerance, assess their overall risk profile, and their evolving risk profile over time.
These constraints are inputs to our capital market simulation engine, used to solve the final optimal glide path, as illustrated in Figure 2.
Figure 2: A flexible and robust optimisation engine allows to incorporate various factors into consideration

Source: AXA IM MAQS as of 31 March 2025. For illustrative purposes only.
In this paper, we focus on the “To” glide path leading up to a retirement date to demonstrate how the multi-period optimisation model works. The investment goal of a “To” solution is to accumulate as much capital as possible for retirement while minimising the loss of principal, according to an investor’s risk profile.
Designing the glide path for a range of risk profiles
The concept of the efficient frontier from modern portfolio theory3 can be extended to multi-period optimisation for glide path design. Instead of simply displaying the highest return portfolios on the efficient frontier for each volatility or VaR (value-at-risk) level, we propose an optimal glide path with a tailored risk/return indicators defined below:
- Return indicator: Internal Rate of Return (IRR), representing the annualised return assuming regular premium investments throughout the investment period.
- Risk indicator: IRR volatility, a proprietary risk measure taking the dynamics of the accumulated capital into account during the whole investment horizon.
Investors with a higher risk profile can choose to invest in a glide path that offers higher expected IRR and IRR risk. This optimal investment solution will be more concentrated on risky assets compared to a solution with a lower risk/return
profile, and they initiate de-risking at a later stage, allowing for extended accumulation of risk premiums. To illustrate the impact of different risk profiles on asset allocation, we have developed three optimal glide paths: Prudent, Balanced and Dynamic. The balanced profile is displayed as an example in (Figure 3).
We can translate the glide path indicators to traditional ones by observing the annual return and volatility of each allocation on the glide path. Figure 4 illustrates the consistency of our glide path construction - the glide paths with higher risk profiles display higher volatilities and higher expected returns over time than glide paths with a lower risk profile.
- The efficient frontier is the set of optimal portfolios that offer the highest expected return for a defined level of risk or the lowest risk for a given level of expected return. Portfolios that lie below the efficient frontier are sub-optimal because they do not provide enough return for the level of risk. Portfolios that cluster to the right of the efficient frontier are sub-optimal because they have a higher level of risk for the defined rate of return. The efficient frontier theory was introduced by Nobel Laureate Harry Markowitz in 1952 and is a cornerstone of modern portfolio theory.
As explained above, even though each investor has an overall risk profile during the life cycle (such as Prudent, Balanced or Dynamic), this risk profile is not constant over time. It is a combined function of the time horizon, financial and human capital, and the investor’s specific risk aversion at each time point in the glide path. Traditional static constant-mix solutions tend to offer sub-optimal efficient frontier under same constraints.
Structuring an optimal glide path
The mix between risky and defensive assets is affected by market conditions and by an investor’s individual needs:
Investment horizon: Younger investors should have a higher risk profile, and therefore more exposure to risky assets. This is due to their higher human capital, as they have many working years ahead, allowing them to recover from potential losses and take on more risk early in their careers.
Current wealth and future contributions: The portion of risky assets will be lower if current wealth is high compared to future income. Similarly, higher future income, and thus higher regular premiums, will lead to a greater acceptance of risk.
Risk tolerance: This measures investors’ willingness to take risk, including their tolerance for potential drawdowns – the maximum acceptable losses over a certain period.
Market asset volatility and risk premiums: Higher risk premiums for risky assets make them more attractive than other assets. However, if the asset is particularly volatile it’s proportion in the optimal solution will decrease.
Asset class correlations: Higher correlation reduces the diversification benefit under the same risk profile. The portion of capital that can be invested in risky assets will decrease.
Our objective: Maximise the expected capital while minimising loss at retirement for all risk profiles
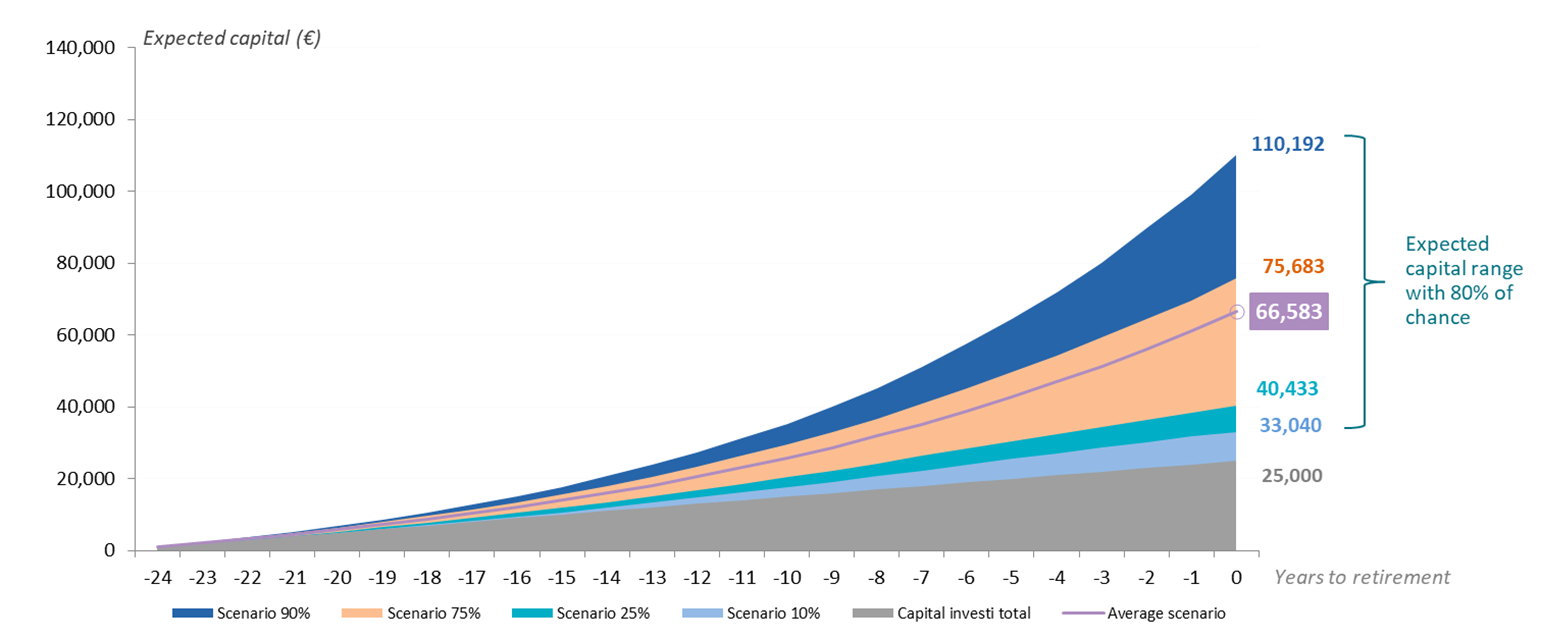
Our capital market simulation tool is a proprietary economic scenario generator based on our forward-looking capital market views. It can simulate the prospective behaviour of a large universe of assets, considering their dependence structure. Using this tool, we can display how the proposed solution should perform over time and how much capital is likely be available at retirement, with a certain confidence level. The expected wealth at retirement, worst-case loss, and probability of reaching a wealth target are typical indicators that are helpful to investors.
Figure 5: Balanced glide path - the evolution of expected capital over an investment horizon

Source AXA IM MAQS. Prospective analysis over 25 years horizon based on AXA IM internal simulation tool, assuming annual premium of 1000€. The reference interest rate curve used is the EUR swap curve as of 08.2024. For illustrative purposes only.
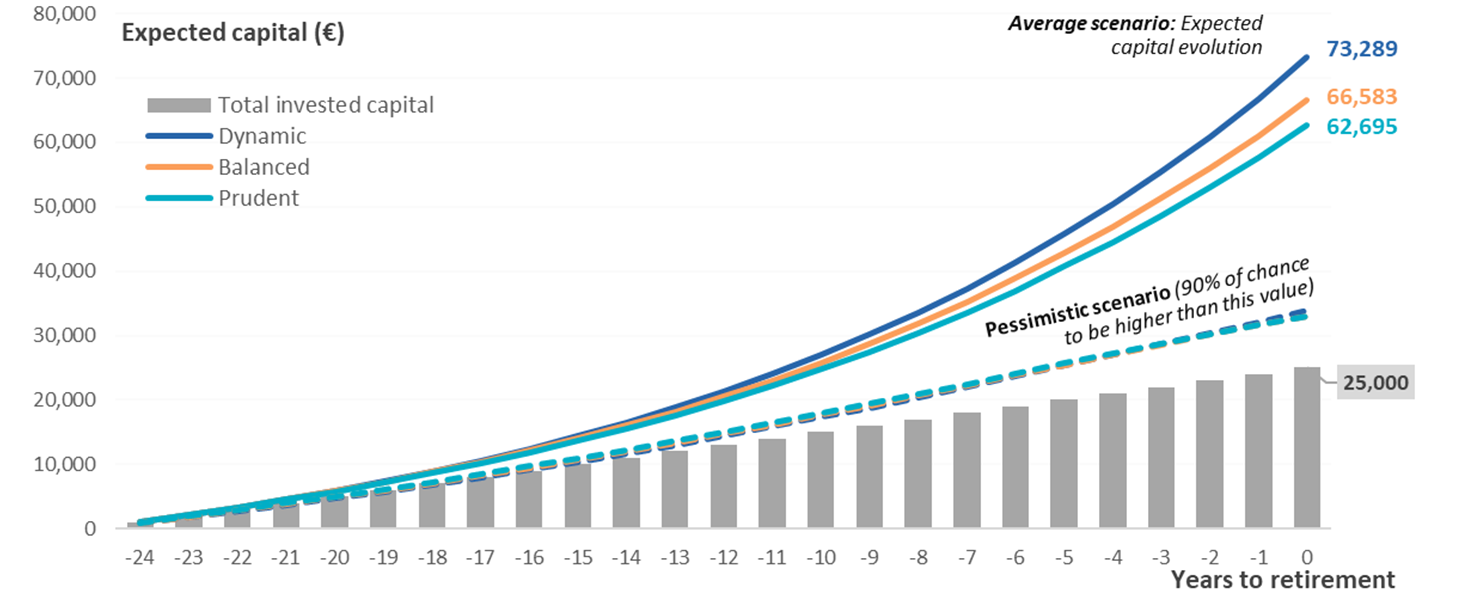
Beyond regulatory and individual factors, we also include risk mitigation at retirement in the glide path design principles. We believe it is important to control the principal loss risk, regardless of risk profile. To this end, we define a risk measure to be carefully controlled for all the risk profiles we propose to end-investors, in collaboration with plan sponsors or advisers. A common approach is to use the 90% VaR as a pessimistic scenario. Figure 6 illustrates that the Dynamic glide path tends to offer higher expected capital at retirement than the Prudent, however the pessimistic scenario at retirement for each risk profile is not significantly different, and they are all higher than the principal value.
Figure 6: The evolution of expected capital (average scenario) and pessimistic scenario over time

Source AXA IM MAQS. Prospective analysis over 25 years horizon based on AXA IM internal simulation tool, assuming annual premium of 1000€. The reference interest rate curve used is the EUR swap curve as of 08.2024. For illustrative purposes only.
Bottom line
In the long run, we expect the shift to DC plans to continue as a dominant trend in global pension markets. Pension products will face stricter regulations aimed at protecting savers and be expected to adapt to the growing demand for individual customisation. How to address these complex issues in a straightforward manner will be a key concern for solution designers. Our flexible multi-period optimization model offers an ideal solution. By incorporating both regulatory requirements and individual preferences into a capital market simulation engine we build investment strategies that strike an optimal balance between portfolio diversification, evolving risk profiles and external constraints. Our goal is to design a long-term allocation that delivers the best investment for the customer’s needs.
Derivatives Overlay
Overlay strategies are investment techniques used to manage specific risks or enhance the performance or risk return profile of an existing investment portfolio.
Explore our strategies
Disclaimer
This document is for informational purposes only and does not constitute investment research or financial analysis relating to transactions in financial instruments as per MIF Directive (2014/65/EU), nor does it constitute on the part of AXA Investment Managers or its affiliated companies an offer to buy or sell any investments, products or services, and should not be considered as solicitation or investment, legal or tax advice, a recommendation for an investment strategy or a personalized recommendation to buy or sell securities.
Due to its simplification, this document is partial and opinions, estimates and forecasts herein are subjective and subject to change without notice. There is no guarantee forecasts made will come to pass. Data, figures, declarations, analysis, predictions and other information in this document is provided based on our state of knowledge at the time of creation of this document. Whilst every care is taken, no representation or warranty (including liability towards third parties), express or implied, is made as to the accuracy, reliability or completeness of the information contained herein. Reliance upon information in this material is at the sole discretion of the recipient. This material does not contain sufficient information to support an investment decision.
AXA IM and BNPP AM are progressively merging and streamlining our legal entities to create a unified structure
AXA Investment Managers joined BNP Paribas Group in July 2025. Following the merger of AXA Investment Managers Paris and BNP PARIBAS ASSET MANAGEMENT Europe and their respective holding companies on December 31, 2025, the combined company now operates under the BNP PARIBAS ASSET MANAGEMENT Europe name.


