Why clean energy is a hot topic
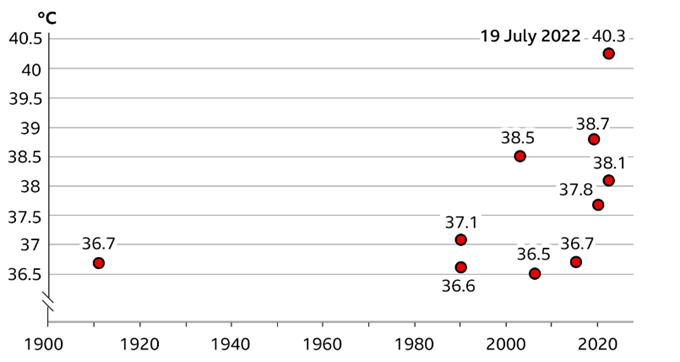
“Blistering heatwave plays havoc with Europe’s strained energy system1”. This is just one headline I read the day after the UK registered its hottest day on record on the 19th of July, registering a maximum temperature of 40.3 Celsius in Coningsby, Lincolnshire. While we should be careful not to conflate the short-term vagaries of weather with longer term climate trends, around 150 scientific attribution studies by the Met Office suggest man-made climate change is driving more extreme weather. Regarding extreme heat, this is succinctly illustrated by the chart below.
Top 10 hottest UK days on record

Source: BBC, Met Office, July 20222
Climate change is causing more extreme weather due to higher (and rising) average temperatures, longer and worse droughts, and more extreme rainfall events.
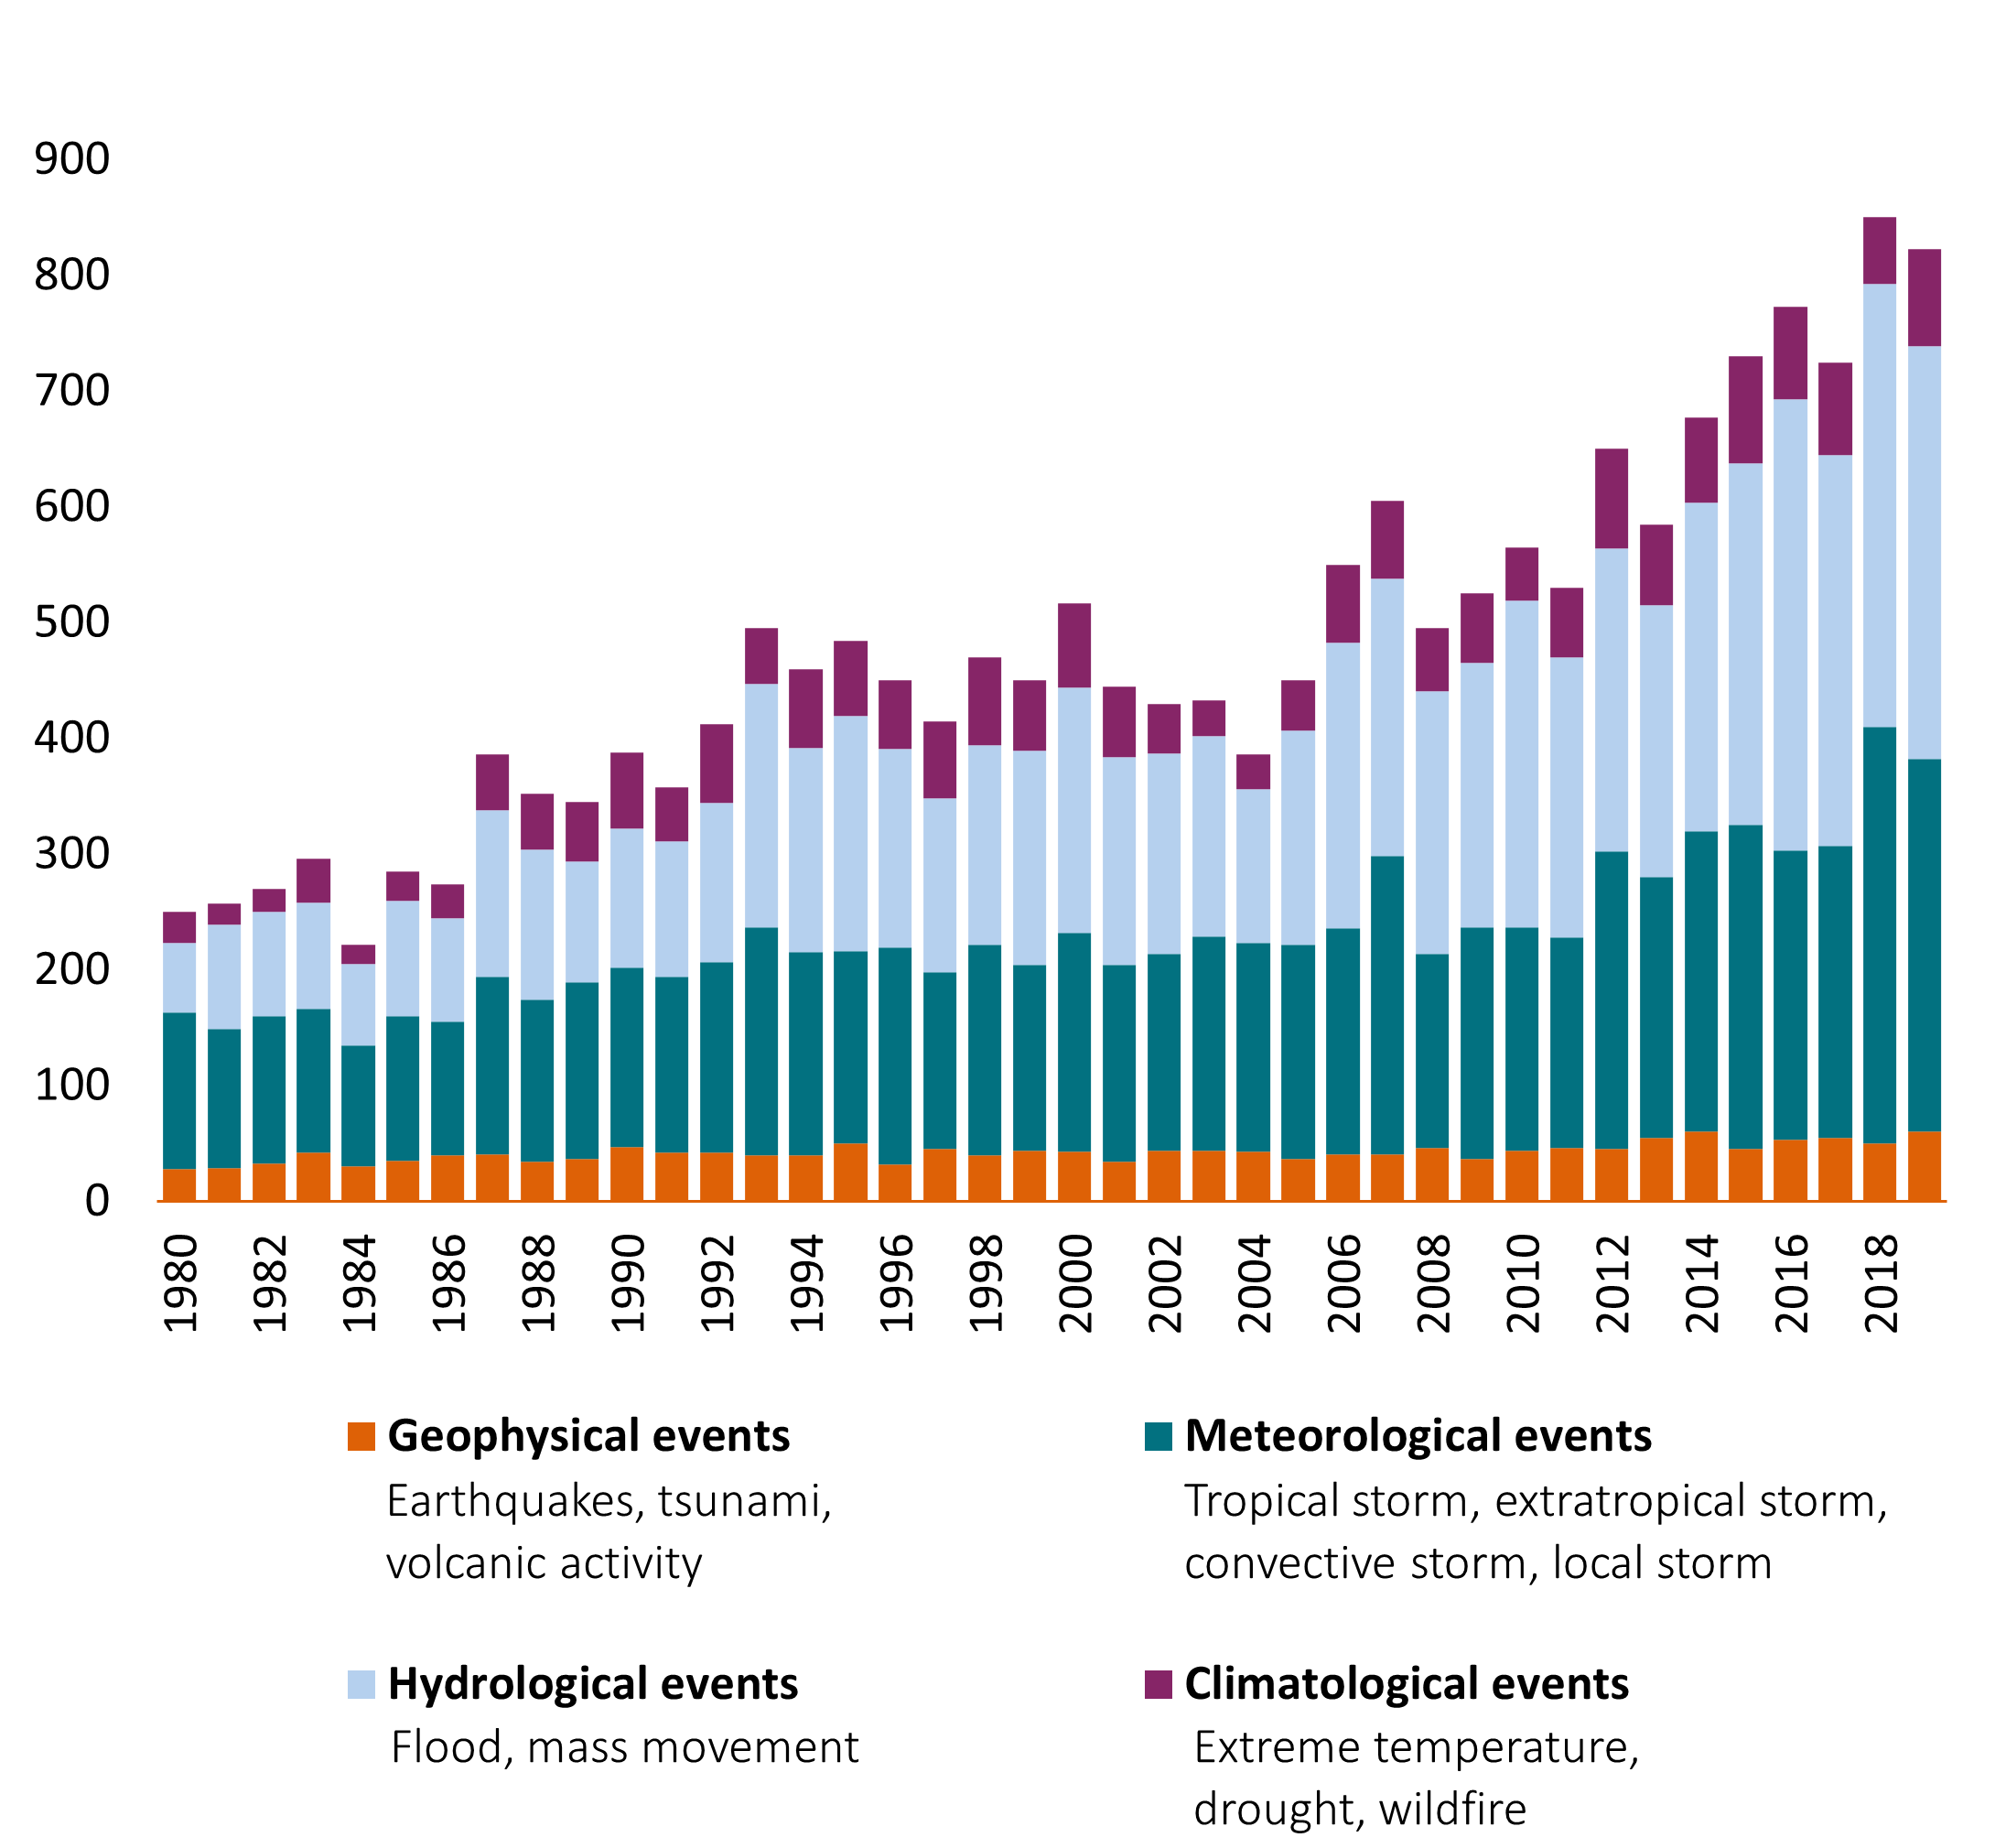
Having clarified the role played by carbon emissions in causing climate change, the incidence of extreme weather events emphasises the ongoing importance of growing investment in clean energy. Interestingly, the Financial Times article cited earlier also highlights how heat from extreme weather leads to higher electricity demand (mainly due to additional demand for air conditioning), tighter nuclear and hydro supply due to river water (used for cooling nuclear power stations) becoming too warm, and droughts leading to insufficient water volumes for optimal hydro generation respectively. This unfortunate situation has affected countries such as France and Switzerland who are likely to resort to additional, and more polluting, coal and gas generation to meet demand. This highlights an unfortunate negative feedback loop in action. The below graph shows how events causing loss are becoming more frequent:

Source: Munich RE, Met Office, July 2022
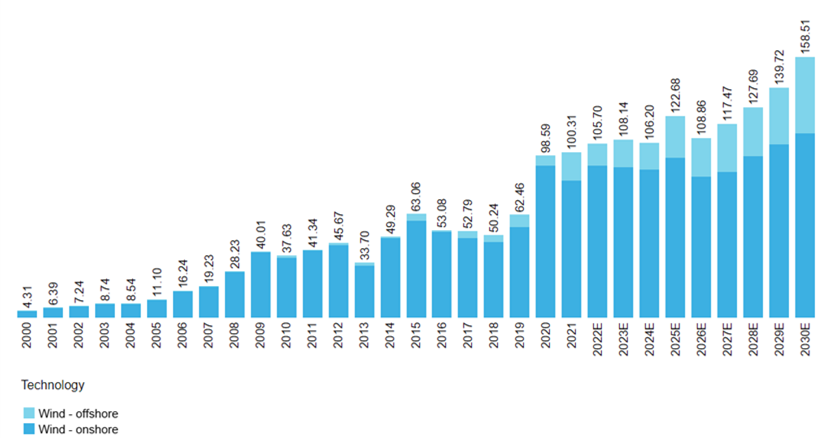
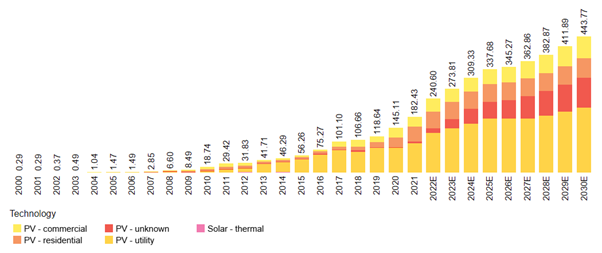
Over the medium and long term, we consider this bullish for clean energy growth – i.e. wind, solar and batteries. We think this thematic tailwind should drive structural growth for the wider sector, while acknowledging shorter duration cyclicality, such as the recently elevated logistics and material cost profiles. Bloomberg New Energy Finance, who forecasting renewables growth, continues to forecast strong growth in clean energy. The charts below show forecasted growth in wind and solar additions. Annual wind installations should rise ~50% from 2022-30 and solar ~85%.
Wind annual new additions (GW)

Solar annual new additions (GW)

Source: Bloomberg New Energy Finance, July 2022
We think growth in both technologies will be driven by their already compelling economics (i.e. offering cheaper all in generation costs versus fossil fuel alternatives), continued improvements in efficiency and technology, and likely ongoing policy support from governments. Against this backdrop, we believe we have better-than-average chances of finding strong-performing stocks in the wind and solar sectors.
- Source: Financial Times, July 2022 https://www.ft.com/content/a3386b16-ea9f-413b-bfb6-b1f4284d45a9
- Source: Heatwave: The UK and Europe's record temperatures in maps and charts - BBC News

Clean Economy
Innovative companies are creating solutions to address pressures on scarce natural resources and the need for greenhouse gas emission reduction.
Find out moreDisclaimer
This document is for informational purposes only and does not constitute investment research or financial analysis relating to transactions in financial instruments as per MIF Directive (2014/65/EU), nor does it constitute on the part of AXA Investment Managers or its affiliated companies an offer to buy or sell any investments, products or services, and should not be considered as solicitation or investment, legal or tax advice, a recommendation for an investment strategy or a personalized recommendation to buy or sell securities.
Due to its simplification, this document is partial and opinions, estimates and forecasts herein are subjective and subject to change without notice. There is no guarantee forecasts made will come to pass. Data, figures, declarations, analysis, predictions and other information in this document is provided based on our state of knowledge at the time of creation of this document. Whilst every care is taken, no representation or warranty (including liability towards third parties), express or implied, is made as to the accuracy, reliability or completeness of the information contained herein. Reliance upon information in this material is at the sole discretion of the recipient. This material does not contain sufficient information to support an investment decision.
Issued in the U.K. by AXA Investment Managers UK Limited, which is authorised and regulated by the Financial Conduct Authority in the U.K. Registered in England and Wales, No: 01431068. Registered Office: 22 Bishopsgate, London, EC2N 4BQ
In other jurisdictions, this document is issued by AXA Investment Managers SA’s affiliates in those countries.