

Market rebound: New year beta bounce brings hope for recovery
Key points
- More upbeat sentiment has driven a sharp relief rally in the stocks and sectors which underperformed for much of 2022
- However low volatility stocks have significantly lagged the wider market rally
- Previous rallies of this nature have often been followed by a wider market recovery
Following a highly challenging 2022, markets appear to have regained their composure so far in 2023– major bond and equity indices are in positive territory year-to-date, while the UK’s blue-chip FTSE 100 has even hit a new high.
Amid this new year wave of respite for embattled investors, we have noticed some very large moves in the relative performance of some popular investment styles – particularly over the last 30 days.
It’s not unusual for Low Volatility shares, i.e., typically defensive stocks, to lag the market during a sharp rally. However, the recent level of underperformance experienced, has in our view, been highly significant. For example, the MSCI Global Minimum Volatility Index (which focuses on low beta stocks) has underperformed the global market by more than 7% in the last 30 days.
As the chart below highlights, comparable levels of relative weakness are quite unusual and historically have marked major market events. Examples include the recovery following the dotcom boom and bust of the early 2000s, or the rally that followed the global financial crisis after markets hit their nadir in March 2009. More recently, we saw a similar event in November 2020 when Pfizer announced it had successfully developed a COVID-19 vaccine.
30-day percentage change in MSCI World Minimum Volatility Index relative to the market
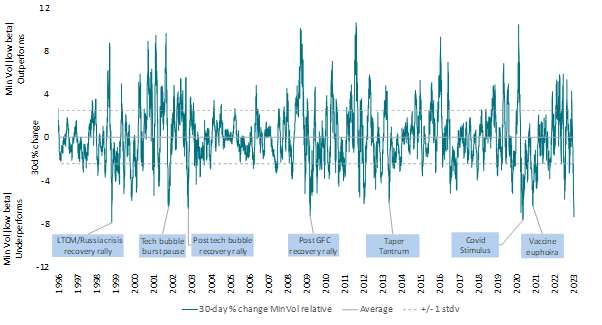
Source: AXA IM EQI, MSCI, Refinitiv Datastream, as of 8 February 2023
High momentum stocks – those with a positive price change, relative to the market, over the last 12 months - have also suffered a large level of relative drawdown in the past 30 days. The trend-following nature of Momentum meant that over the course of the last year it had become increasing correlated with lower beta stocks.
Low Volatility and Momentum drawdowns don’t always occur at the same time and indeed the magnitude that both have experienced over the last 30 days is rarer still.
What’s the driver and what’s next?
Unlike the financial crisis recovery or the coronavirus vaccine discovery, the current rally and associated factor dramatics do seem to have less obvious catalysts. What has changed in the first part of 2023 is sentiment. It has vastly improved in the wake of China’s re-opening, easing inflation and a downgrading of the likelihood of economic recession in the US and Europe – together they have driven a sharp relief rally in the stocks, sectors and investment styles (i.e. factors) that underperformed for much of last year.
Historically, low beta weakness or high beta rallies of this magnitude have generally been a positive market signal. The table below details subsequent 130-day and 260-day returns of the MSCI World Index following periods when the MSCI Minimum Volatility Index experienced similar levels of weakness as they have so far in 2023.
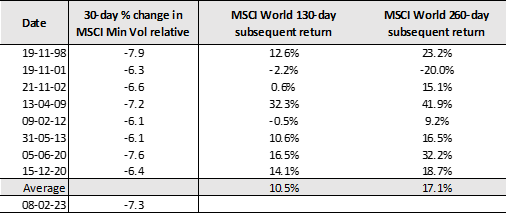
Source: AXA IM EQI, MSCI, Refinitiv Datastream, as of 8 February 2023
Of course, there are exceptions to which investors should pay close attention. In 2001 the market rallied after significant falls from tech bubble highs; however, this proved to be a false start and markets went on to fall further. It’s also worth noting the low-quality nature of the current recovery; through a deeper dive into the data of the outperforming high beta stocks, we find it’s ‘lower quality-high beta’ stocks that have led the market.
Historically, our observation is that it is not unusual for ‘lower quality-high beta’ to lead a relief rally. But we also note that these phases of market rallies, while intense, have historically tended to be brief. Furthermore, such stocks historically have not been the source of a sustained market rally.
It is of course important to note that simply looking at past performance patterns ignores important differences in macroeconomic conditions and market valuation, so in isolation should not be seen a guide to future returns. But after the drawdown seen in equity markets over 2022, signs of hope are to be welcomed.

Our experts and investment teams outline their key convictions
Visit the Investment InstituteDisclaimer
This document is for informational purposes only and does not constitute investment research or financial analysis relating to transactions in financial instruments as per MIF Directive (2014/65/EU), nor does it constitute on the part of AXA Investment Managers or its affiliated companies an offer to buy or sell any investments, products or services, and should not be considered as solicitation or investment, legal or tax advice, a recommendation for an investment strategy or a personalized recommendation to buy or sell securities.
Due to its simplification, this document is partial and opinions, estimates and forecasts herein are subjective and subject to change without notice. There is no guarantee forecasts made will come to pass. Data, figures, declarations, analysis, predictions and other information in this document is provided based on our state of knowledge at the time of creation of this document. Whilst every care is taken, no representation or warranty (including liability towards third parties), express or implied, is made as to the accuracy, reliability or completeness of the information contained herein. Reliance upon information in this material is at the sole discretion of the recipient. This material does not contain sufficient information to support an investment decision.
Issued in the UK by AXA Investment Managers UK Limited, which is authorised and regulated by the Financial Conduct Authority in the UK. Registered in England and Wales, No: 01431068. Registered Office: 22 Bishopsgate, London, EC2N 4BQ.
In other jurisdictions, this document is issued by AXA Investment Managers SA’s affiliates in those countries.
© 2023 AXA Investment Managers. All rights reserved
AXA IM and BNPP AM are progressively merging and streamlining our legal entities to create a unified structure
AXA Investment Managers joined BNP Paribas Group in July 2025. Following the merger of AXA Investment Managers Paris and BNP PARIBAS ASSET MANAGEMENT Europe and their respective holding companies on December 31, 2025, the combined company now operates under the BNP PARIBAS ASSET MANAGEMENT Europe name.