
US High Yield Market commentary and Outlook
- 06 September 2023 (7 min read)
US High Yield Trading Comments
(stats as of 8/31/23)
- Given recent rate volatility and general increase of US Treasury yields, high yield corporates have adjusted extremely well and remain close to year-to-date tights on spread and yield (385bps option-adjusted spread and 8.47% yield-to-worst). Defaults remain historically low and high yield companies still have plenty of runway to address near term financing needs.
- After being down as much as -1.18% through to August 21st, a +1.45% rally over the past 8 sessions has raised month-to-date high yield total returns to +0.29%. High yield is now up +7.22% year to date.
- Compression has remained the dominant theme for much of 2023 and continued in August with CCCs rallying +1.02% vs BBs being down -0.04%. Both higher rates and higher absolute dollar price resulted in BB bonds being targeted by accounts as sale candidates to buy lower dollar, riskier paper.
- While new issuance has been light, the early forward calendar for September looks fairly robust with a mix of M&A and more traditional refinancings. Banks have largely cleared out any hung debt remaining from 2022’s leveraged buyout (LBO) activity allowing for a healthy and active leveraged financing environment.
- Dealers were net sellers of high yield bonds to the tune of $6.5 billion MTD and $7.8 billion YTD.
- Trading volumes were in line with the typical late summer holiday period averaging $6.6 billion a day over the last 20 days. Average high yield trading volumes are $10.2 billion MTD and $12.6 billion YTD.
- US Federal Reserve (Fed) policy meetings and subsequent rate decisions remain a key focus for credit markets as do economic indicators tied to inflationary trends and employment data. Recent data has indicated a softening in peripheral inflationary markers while the general economy continues to perform well.
US High Yield Research and Portfolio Management Comments
- The high yield market produced a positive total return over the summer, held back slightly by some underperformance in the BB rated portion of the market, which had a slight negative total return in August while facing pressure from rising rates.
- Second quarter results from issuers in our portfolios were decent in aggregate, however we continue to see significant variation in results depending on the industry.
- On the fundamental side, we continue to observe several developing trends in financial results, including:
- Positive results from portions of the Services, Software, Leisure and Healthcare space.
- Strength in consumer at aggregate level, however beginning to see evidence of consumers “trading down” to lower price options within some parts of the consumer goods and retail sector.
- The potential for diverging trends from sector to sector over the next few quarters:
- For example, some industries, such as portions of the Basic Industry and Capital Goods sector, have experienced the initial stage of an economic pullback and may begin to experience improving results as costs decline and customer inventory destocking concludes.
- Other industries may just be entering into an economic pullback phase and we see the risk of guidance to be lowered, including portions of the Tech sector and consumer-facing industries that have held up better than expected.
- Levered issuers in sectors with high free cash flow conversion managing the higher interest rate environment better than levered peers in sectors with historically lower free cash flow generation.
- We expect the primary market to pick up in activity and present attractive investment opportunities for our high yield strategies:
- We expect refinancing deals to continue to comprise the majority of new issuance, and we will see more “pull to par” opportunities with short duration maturities in the 2024-2026 range.
- We note that some new LBO structures set in today’s higher interest rate environment look attractive to us with better levels of interest coverage when compared to other existing structures set during a lower rate environment, if we assume older structures reset at today’s coupon level. We also note that the market is generally requiring larger equity contributions from private equity sponsors and banks are syndicating portions of the secured debt to the bond market as opposed to only syndicating junior unsecured debt to the bond market.
Outlook
The US high yield market continues to defy investor expectations, many of whom came into 2023 expecting to see a more immediate downturn in the US economy.
Thus far, this narrative has not played out as expected and the US high yield market has responded positively to a US economy which continues to show signs of resilience. With headline inflation falling sharply, market expectations for a soft landing have increased progressively throughout the year. This has led the US high yield market to deliver a YTD performance to August 31st of +7.2%, outperforming higher quality fixed income asset classes such as US Investment Grade (+3.0%), US Treasuries (+0.6%) and short-term cash rates as proxied by the 0-3 month Treasury (+3.2%) (Source: ICE BofA).
Although the Fed remains cautious as to how it signals where rates may go from here, we believe that we are at the end, or very close to the end, of the hiking cycle – after the most recent 25bps hike in July. This has typically been a very favourable entry point for high yield investors, as shown by the chart below – which highlights the average spread and yield across the previous five Fed hiking cycles, together with the forward-looking returns across various time periods:
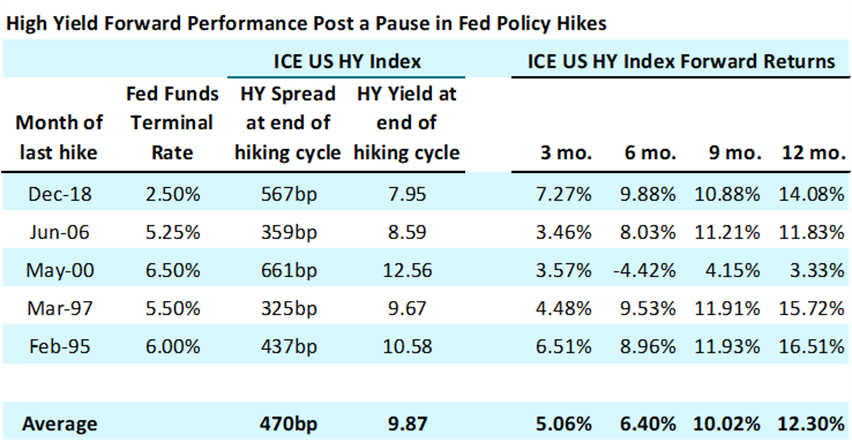
Source: AXA IM, Bloomberg as of 31st August 2023
Although the market today appears a little expensive (mainly from a spread perspective) compared to average levels post a pause in Fed hikes, it would not take a lot for us to reach the average spread level of 470bps, which we hit as recently as May 2023. It is also worth noting that in two out of five of these hiking cycles, the spread at the end of the cycle was actually lower than today.
An important point to note is the forward returns after the last Fed hike, with an average 12-month forward return of 12.3%. The reason for this attractive level of return is, firstly, because the rise in interest rates corresponds to coupons being reset at higher levels and income taking over as a much more significant driver of returns. Secondly, the pass through of higher rates into the economy tends to drive a slowdown and sometimes outright recession, accompanied by an easing in Fed policy (i.e., rate cuts) which, although might see spreads widen in the short term, does not tend to last for long in typical credit cycles and may be positively offset through a lowering of underlying treasury yields.
Ultimately, whichever path the Fed takes, we expect GDP for the calendar years 2023 and 2024 to remain positive in the 0-2% range. This tends to mean the best of both worlds for the high yield market, in which many companies are able to deliver solid earnings growth, without suffering the effects of an economy which is running too hot and leads to increased costs for high yield companies through a combination of price inflation and higher interest expense via tightening monetary policy.
Annualised index performance
| 2022 | 2021 | 2020 | 2019 | 2018 | |
|---|---|---|---|---|---|
| ICE BofA US High Yield Master II | -11.2% | 5.36% | 6.15% | 14.41% | -2.24% |
Past performance is not a reliable indicator of future performance
References to companies and sector are for illustrative purposes only and should not be viewed as investment recommendations.
Disclaimer
This document is for informational purposes only and does not constitute investment research or financial analysis relating to transactions in financial instruments as per MIF Directive (2014/65/EU), nor does it constitute on the part of AXA Investment Managers or its affiliated companies an offer to buy or sell any investments, products or services, and should not be considered as solicitation or investment, legal or tax advice, a recommendation for an investment strategy or a personalized recommendation to buy or sell securities.
Due to its simplification, this document is partial and opinions, estimates and forecasts herein are subjective and subject to change without notice. There is no guarantee forecasts made will come to pass. Data, figures, declarations, analysis, predictions and other information in this document is provided based on our state of knowledge at the time of creation of this document. Whilst every care is taken, no representation or warranty (including liability towards third parties), express or implied, is made as to the accuracy, reliability or completeness of the information contained herein. Reliance upon information in this material is at the sole discretion of the recipient. This material does not contain sufficient information to support an investment decision.
Issued in the UK by AXA Investment Managers UK Limited, which is authorised and regulated by the Financial Conduct Authority in the UK. Registered in England and Wales No: 01431068. Registered Office: 22 Bishopsgate London EC2N 4BQ
In other jurisdictions, this document is issued by AXA Investment Managers SA’s affiliates in those countries.